
CIO Insights: Market Mile Markers – November 2026
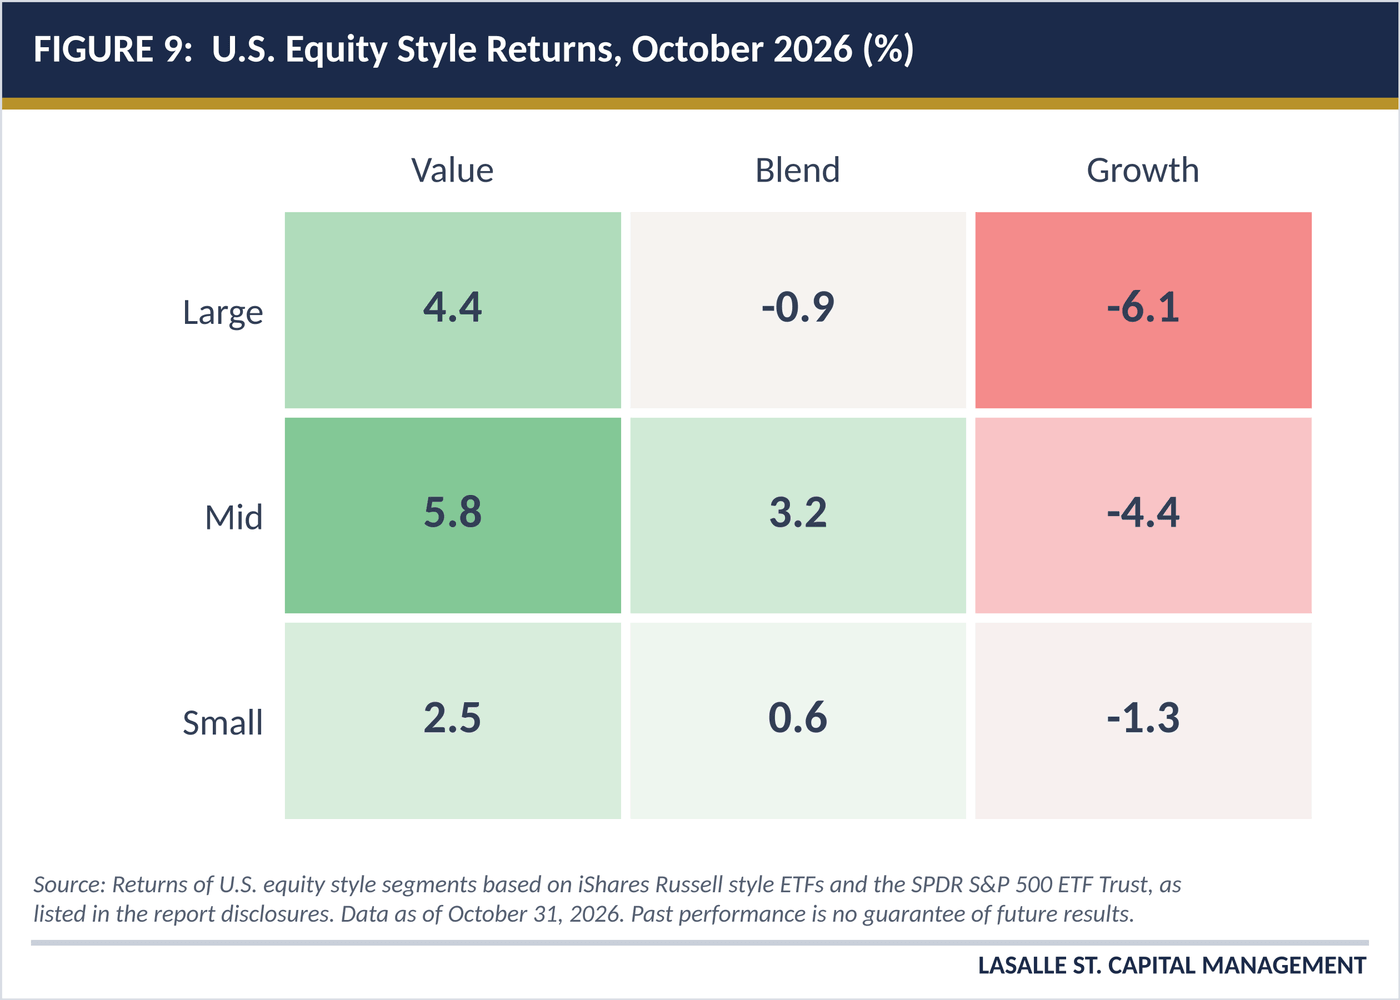
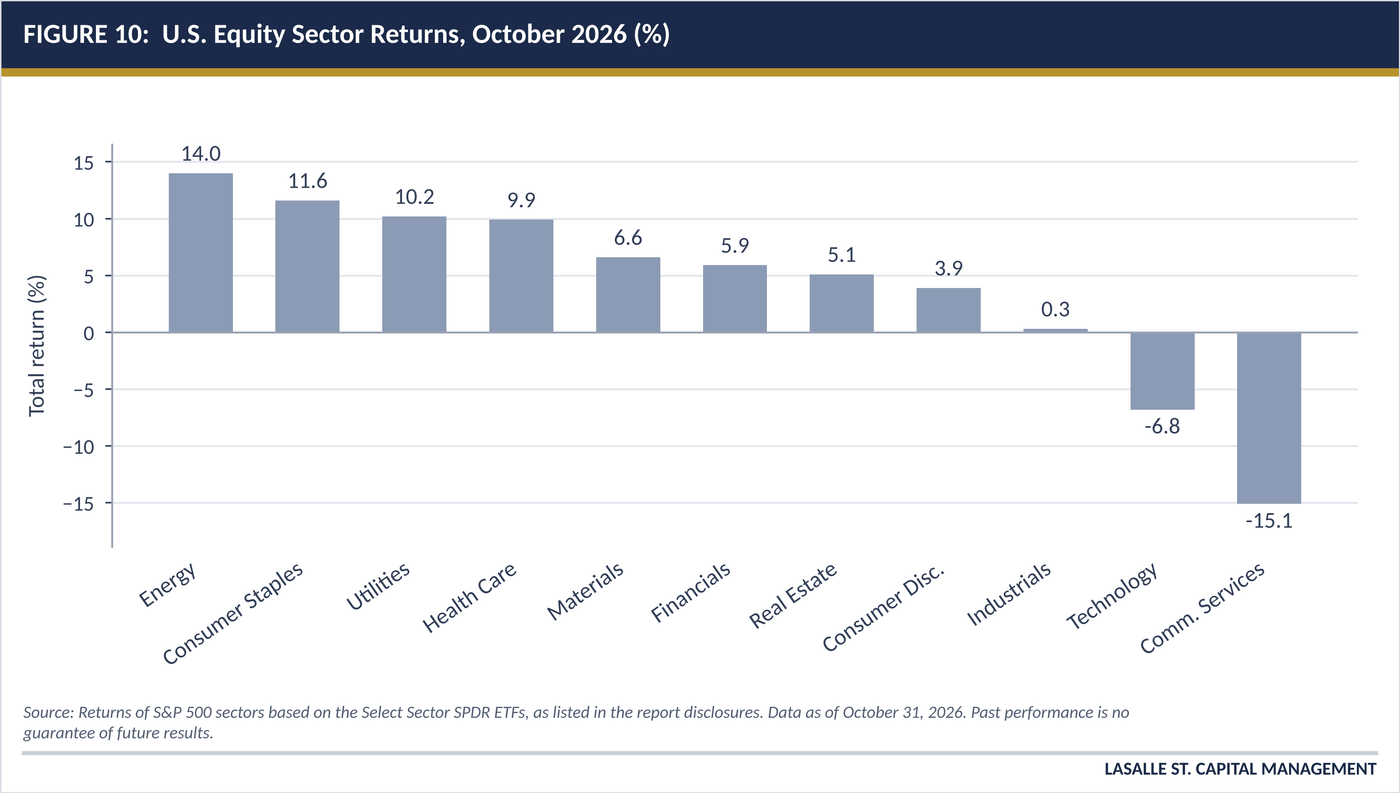
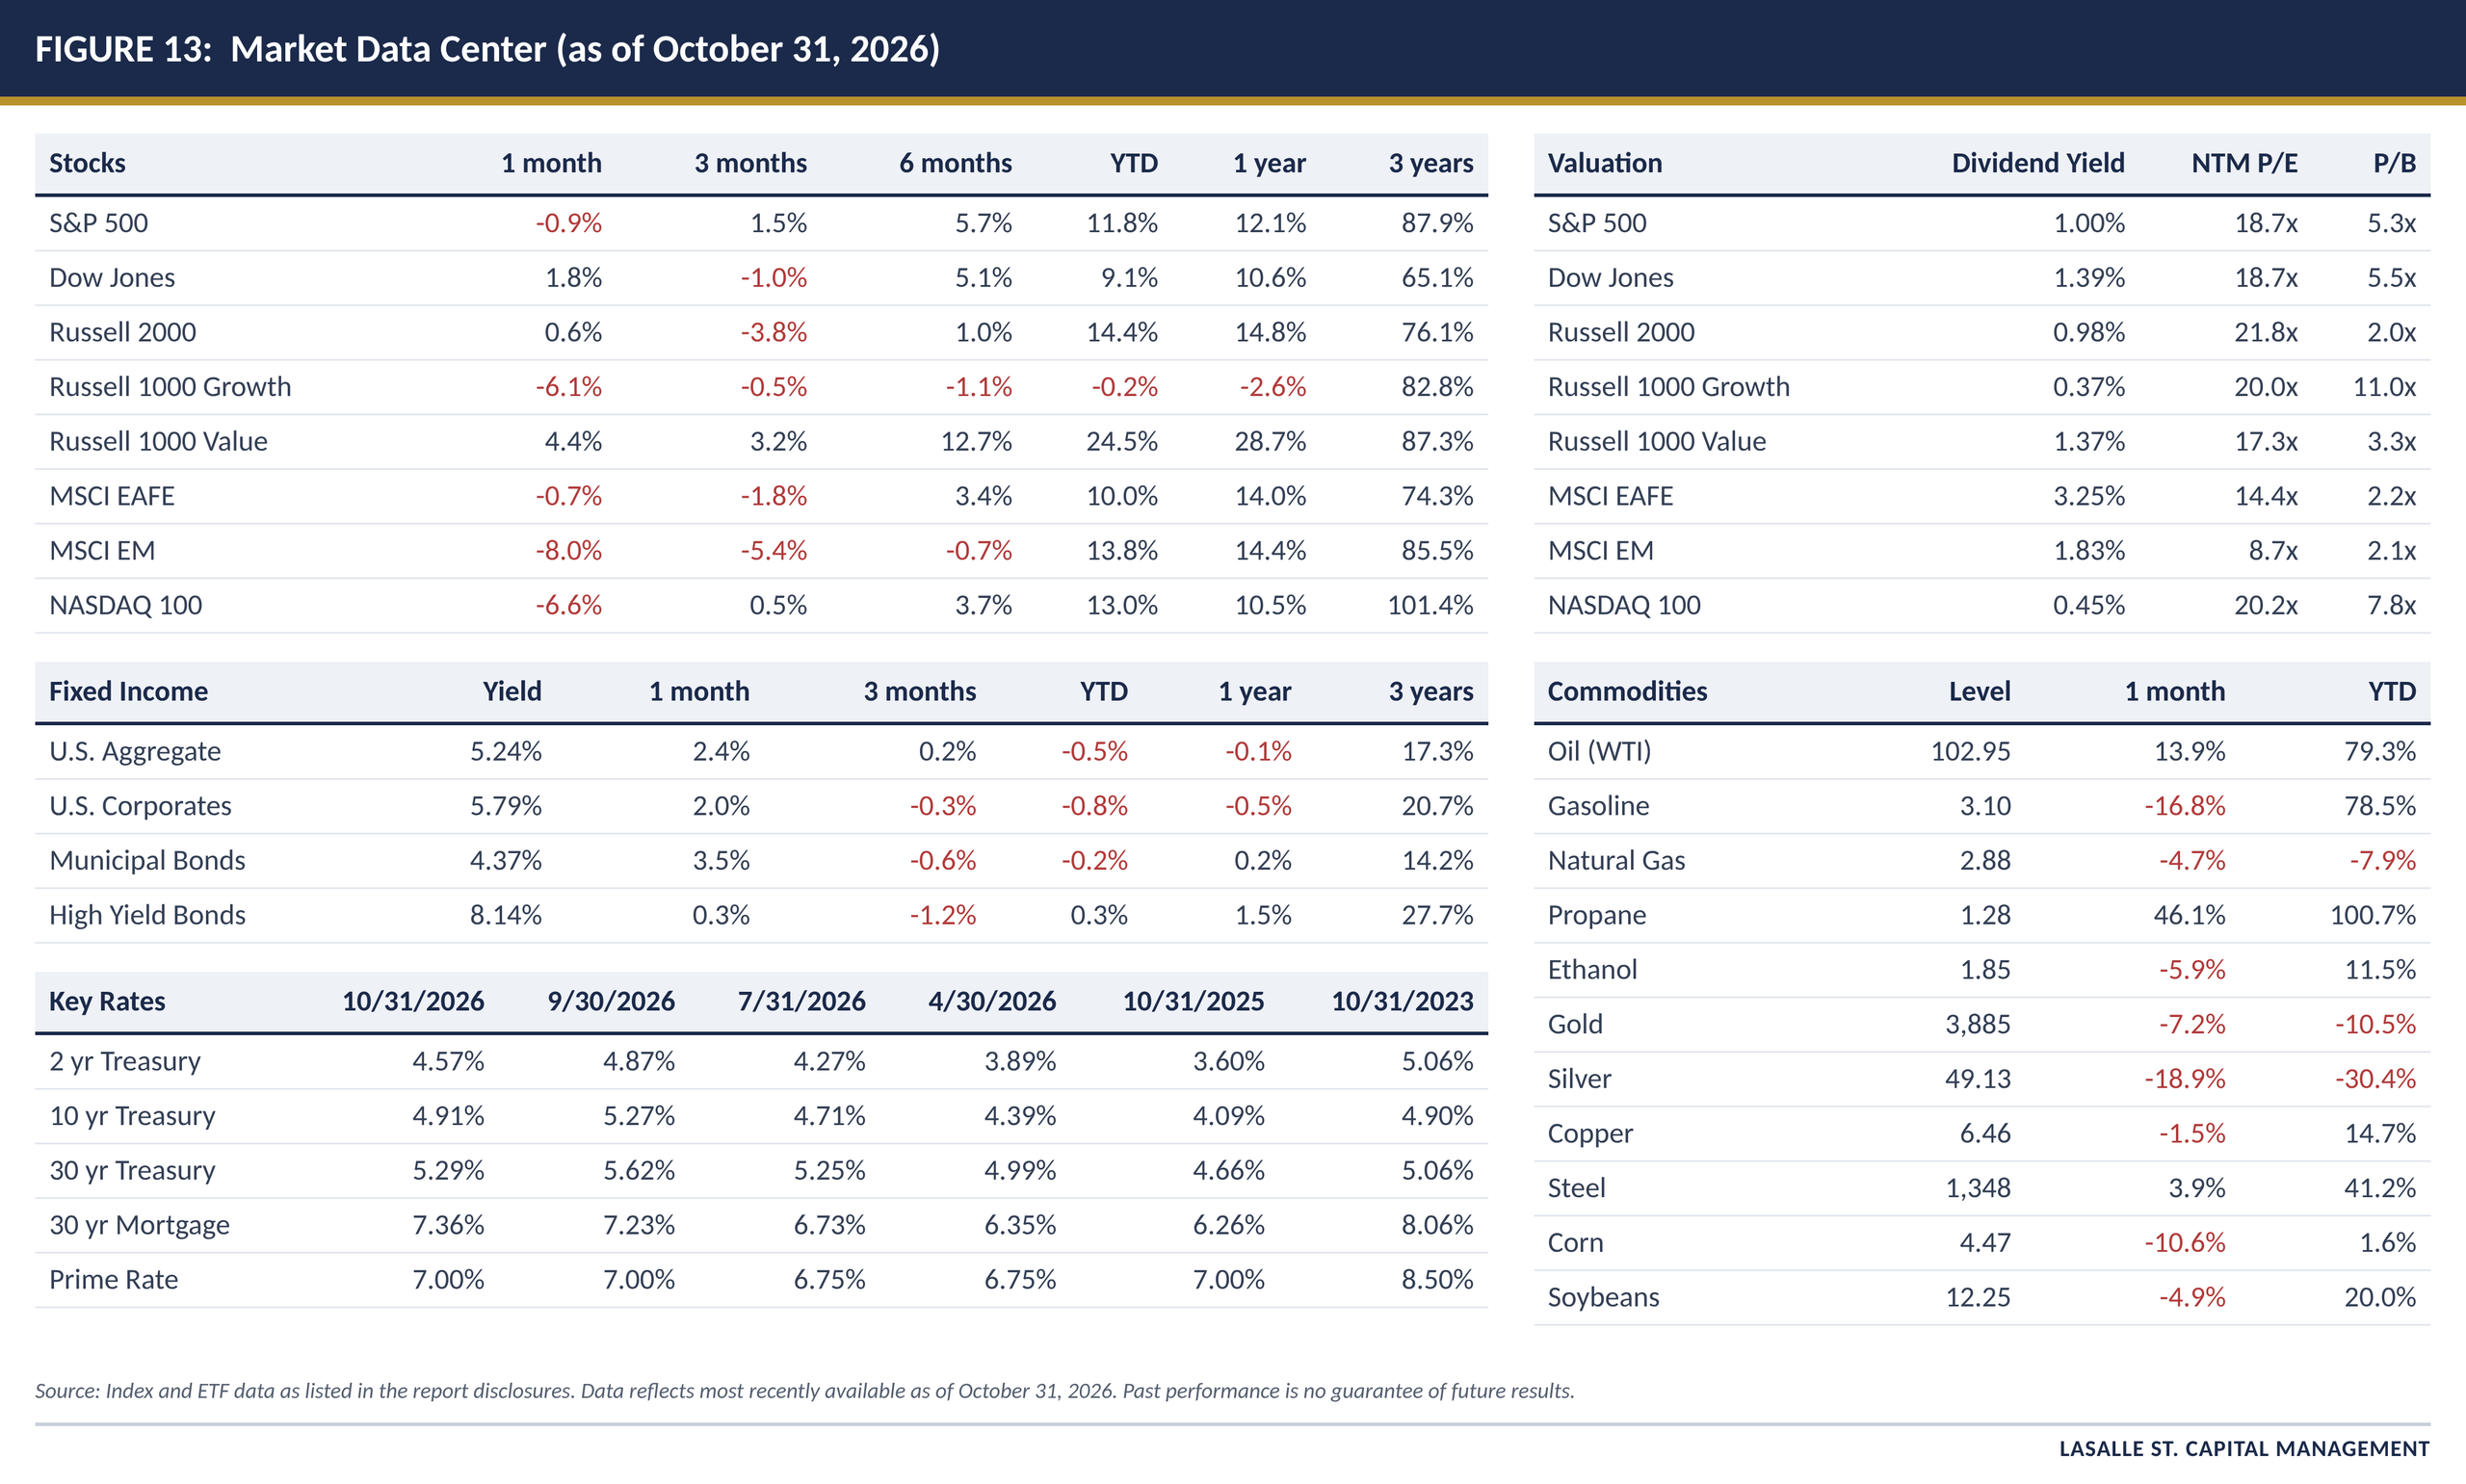
At a glance: The S&P 500 returned -0.9% in October after setting a record high early in the month, as a sharp selloff in AI-related stocks offset gains across most of the market. The Dow rose 1.8%, while the Nasdaq 100 fell 6.6% and semiconductor stocks dropped 15.4%. Nine of 11 sectors finished higher. Energy (+14.0%) led as oil prices surged, followed by Consumer Staples (+11.6%), Utilities (+10.2%), and Health Care (+9.9%), while Communication Services (-15.1%) and Technology (-6.8%) lagged. The equal-weighted S&P 500, which gives each company the same weight regardless of size, gained 4.9%, and small caps (Russell 2000) rose 0.6%. International stocks lagged, as emerging markets fell 8.0% on a selloff in Asian chipmakers.
Bonds cushioned the stock decline. The 10-year Treasury yield reached its highest level in more than two decades early in the month, then fell 0.36 percentage point to 4.91% by month-end. The broad U.S. bond market (Bloomberg U.S. Aggregate) returned 2.4%. Long-duration Treasuries returned 5.1% and municipal bonds returned 3.5%. Investment-grade corporate bonds (+2.0%) outperformed high-yield bonds (+0.3%). Oil (WTI) rose 13.9% after attacks on Saudi energy infrastructure, while gold fell 7.2% to a 12-month low.
The Federal Reserve held its policy rate at 3.75% to 4.00% in October after raising rates in September. Two policymakers dissented in favor of another increase, and futures markets now price roughly a 75% chance of a rate hike in December. Inflation remained above the Fed’s 2% target at 3.7%, driven largely by energy prices, while core inflation, which excludes food and energy, was 2.6%.
KEY TAKEAWAYS
- Markets: October’s AI selloff appeared to reflect concerns about spending more than demand. Technology earnings estimates rose even as the sector fell 6.8%, investors rotated toward defensive stocks rather than leaving the market, and Treasuries cushioned the decline.
- The Fed: The Fed held rates steady in October, but two dissents in favor of a hike and a strong growth outlook have markets pricing a likely December increase.
- Labor: Hiring has slowed sharply even as output grows. Payrolls rose by just 29,000 in September, while productivity rose 2.2% over the past year on hours worked that rose only 0.2%. Labor’s share of business income fell to 52.8%, the lowest on record.
- The wealth pump: Over the past five decades, productivity has grown far faster than typical pay, a pattern historian Peter Turchin calls the “wealth pump.” AI could intensify that shift.
- Tax base: About 86% of federal revenue comes from individual income and payroll taxes, and roughly two-thirds is tied directly to wages and salaries. Income that shifts from paychecks to profits is generally taxed at lower rates.
- Treasuries: A jobless recovery pulls bond yields in two directions. Slower wage growth and easing inflation would support shorter maturities, while larger deficits and heavy issuance would keep pressure on long-term yields. Our base case is a steeper yield curve, although we also see scenarios in which yields fall across maturities or long-term yields rise further.
- Midterms: Democrats won control of both chambers of Congress, creating divided government with a Republican administration. Historically, the 10-year Treasury yield has declined on average after midterms that produced divided government, but the record is mixed and the sample is small.
- Positioning: At our November meeting, the Investment Committee became incrementally more cautious under its rules-based process. We reduced core U.S. large-cap stock exposure, bringing our tactical equity overweight back to its strategic target, trimmed U.S. small caps, and modestly increased cash and ultra-short fixed income. This builds on the October changes: a neutral duration stance in core bonds, a quality tilt within U.S. large caps, and diversified commodities for broader inflation exposure.
More Output, Fewer Paychecks: What a Jobless Recovery Means for Bonds
By Michael Drozd, CIMA, Chief Investment Officer, LaSalle St. Capital Management
The U.S. economy continues to grow, corporate profits are near record levels, and productivity is rising. Hiring, however, has slowed sharply. This combination, often called a “jobless recovery,” has occurred before, but artificial intelligence (AI) may make it more persistent. October also showed investors drawing a sharper line between companies that can fund the AI buildout from their own cash and those that cannot. This month’s Mile Marker reviews October’s markets, then examines how a jobless recovery could affect household incomes, federal tax revenue, and, ultimately, the Treasury bond market.
October in Review: Markets Question Heavy AI Spending
A Selloff Driven by Spending Concerns
October’s decline in AI-related stocks did not appear to reflect weaker profit expectations. Forward earnings estimates for the Technology sector rose 5.3% during the month even as the sector fell 6.8%. Instead, investors appeared to question the cost of the AI buildout. Third-quarter results showed capital spending at several of the largest technology companies running ahead of the cash their businesses generate. Alphabet had its worst day as a public company after its free cash flow, the cash left over after capital spending, turned negative, and Meta announced a stock-based financing plan of roughly $95 billion. Microsoft’s shares held steady after it reported solid free cash flow. Semiconductor companies, whose sales depend on that spending, fell about 15%.1
In our view, the market is now favoring companies that can fund the buildout from their own cash, while the heaviest spenders and their suppliers may face more volatility until that spending shows a return. The same buildout is also changing how many workers these companies need, a theme we explore below.
A Rotation, Not a Retreat
The selling was concentrated in AI stocks rather than the broad market. The equal-weighted S&P 500 outperformed the market-cap-weighted index by the widest monthly margin since 2009. Consumer Staples, Utilities, and Health Care posted some of their best monthly returns in two decades. Low-volatility and dividend-paying stocks led, while momentum stocks, the year’s biggest winners, fell 10.5%. Broad gains led by defensive sectors are often a sign that investors want to stay invested while taking less risk.1
Bonds Provided a Cushion, but Credit Showed Strain
Treasuries rallied during the selloff. Yields declined across maturities even as expectations for a December rate hike rose, a sign that investors bought Treasuries for safety rather than on hopes of lower policy rates. That contrasts with July, when oil-driven inflation fears sent stocks and bonds lower together. Beneath the surface, credit weakened. The gap between yields on CCC-rated bonds, the lowest-quality tier of the high-yield market, and BB-rated bonds widened to about 11 percentage points.1 Gold fell to a 12-month low as rising rate-hike expectations appeared to outweigh demand for safe havens, so Treasuries, rather than gold, provided the offset to falling stocks in October.
Earnings Remain the Market’s Main Support
Profits are not the market’s problem. With about 60% of S&P 500 companies reporting, 82% have beaten estimates, and blended third-quarter earnings growth stands near 30%, the third straight quarter above 25%. Profit margins remain near record levels, and analysts raised fourth-quarter estimates in October. Valuations have also reset lower. The S&P 500’s forward price-to-earnings ratio fell to 18.7 from 19.3 during October, and over the past three months earnings estimates have risen 7.6% while the index has gained 1.2%. Notably, the largest technology companies are now growing earnings more slowly than the rest of the index for the first time since late 2022, as one-time charges and rising AI spending weigh on their profits. Investors are increasingly judging profits by how much remains after capital spending.
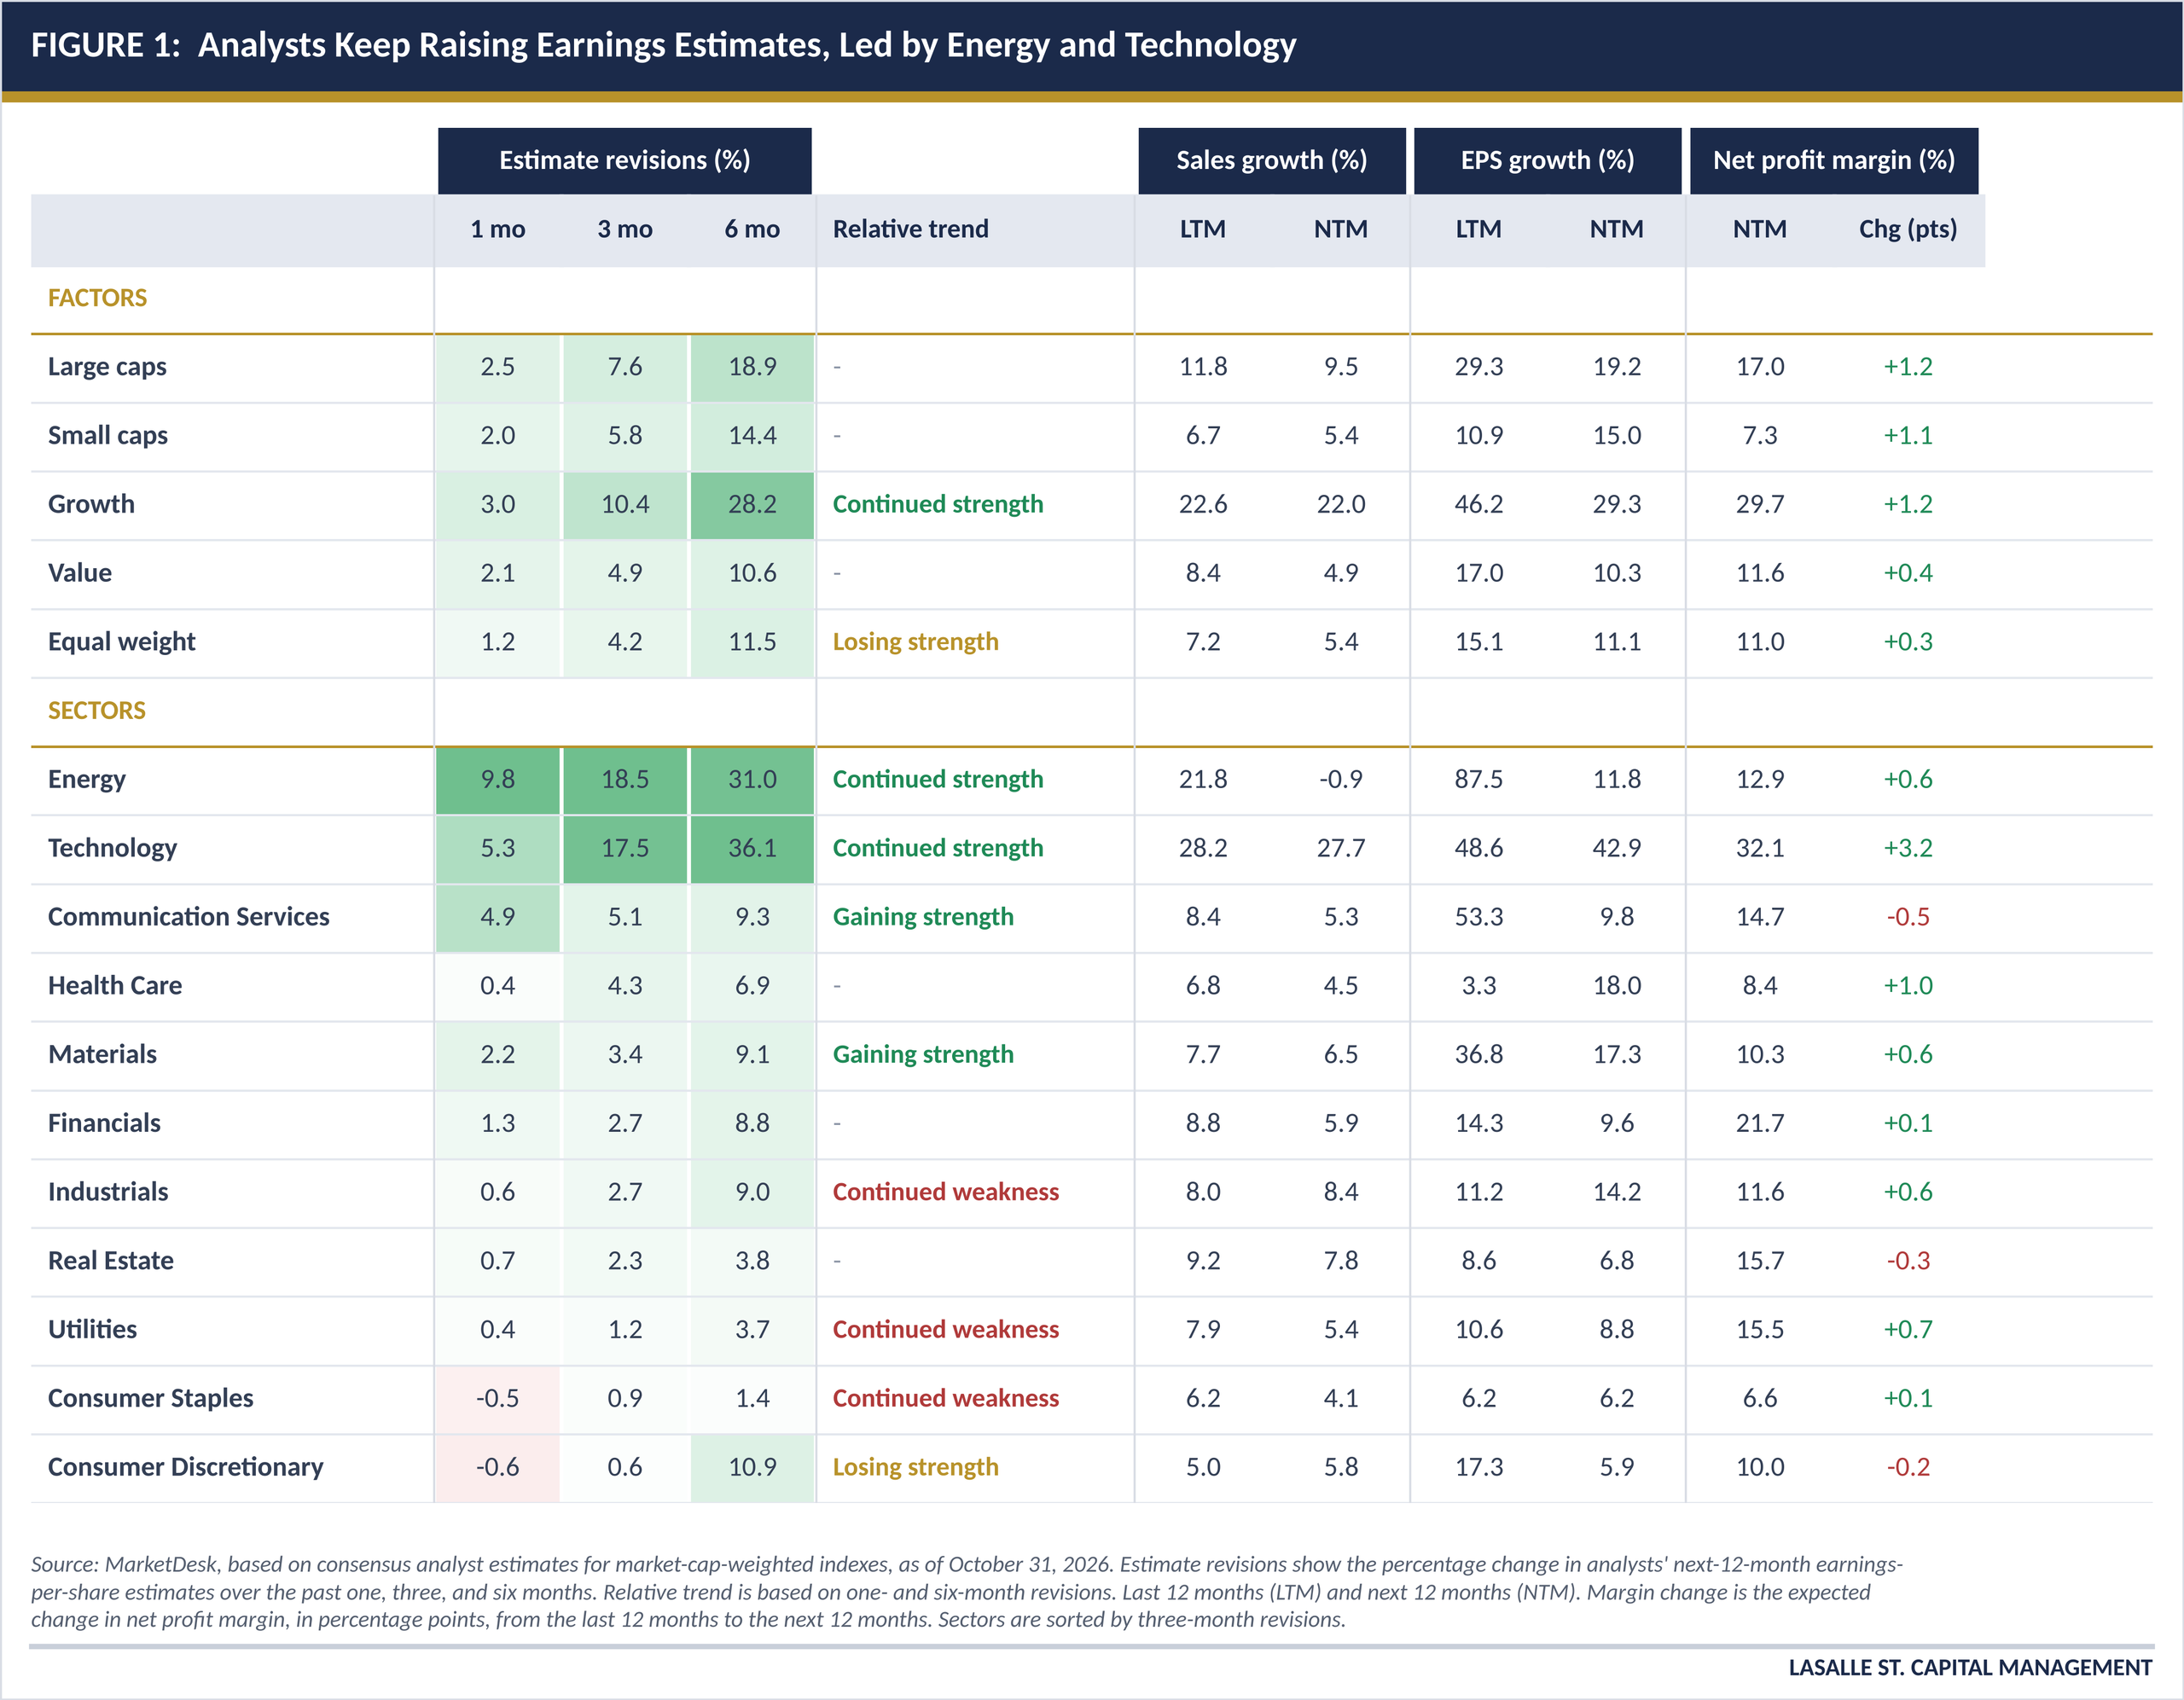
Earnings estimate revisions show where analysts’ expectations are moving (Figure 1). Over the past three months, analysts raised next-12-month earnings estimates most for Energy (+18.5%) and Technology (+17.5%), and for growth stocks broadly (+10.4%). Estimates for Consumer Staples (+0.9%), Utilities (+1.2%), and Consumer Discretionary (+0.6%) barely moved. In other words, October’s rally in defensive sectors appears to have reflected a preference for safety rather than improving earnings in those sectors. Earnings growth is also expected to moderate from very high levels. Large-cap earnings grew 29.3% over the past 12 months, and analysts expect 19.2% over the next 12 months, while net profit margins are projected to rise further, to 17.0% from 15.8%. Small caps, Health Care, and Industrials are among the few areas where expected earnings growth is accelerating.1
A Low-Hire Economy
Recent labor data show an economy producing more with roughly the same number of workers. Employers added just 29,000 jobs in September, and job growth has averaged about 68,000 per month in 2026. The hiring rate, the share of workers newly hired each month, was 3.3% in August, near its lowest level since 2011 outside of the pandemic. At the same time, productivity, or output per hour worked, rose 2.2% over the year ending in the second quarter, while total hours worked rose just 0.2%. Labor’s share of business income, the portion of output paid to workers as compensation, fell to 52.8%, the lowest reading since records began in 1947.2
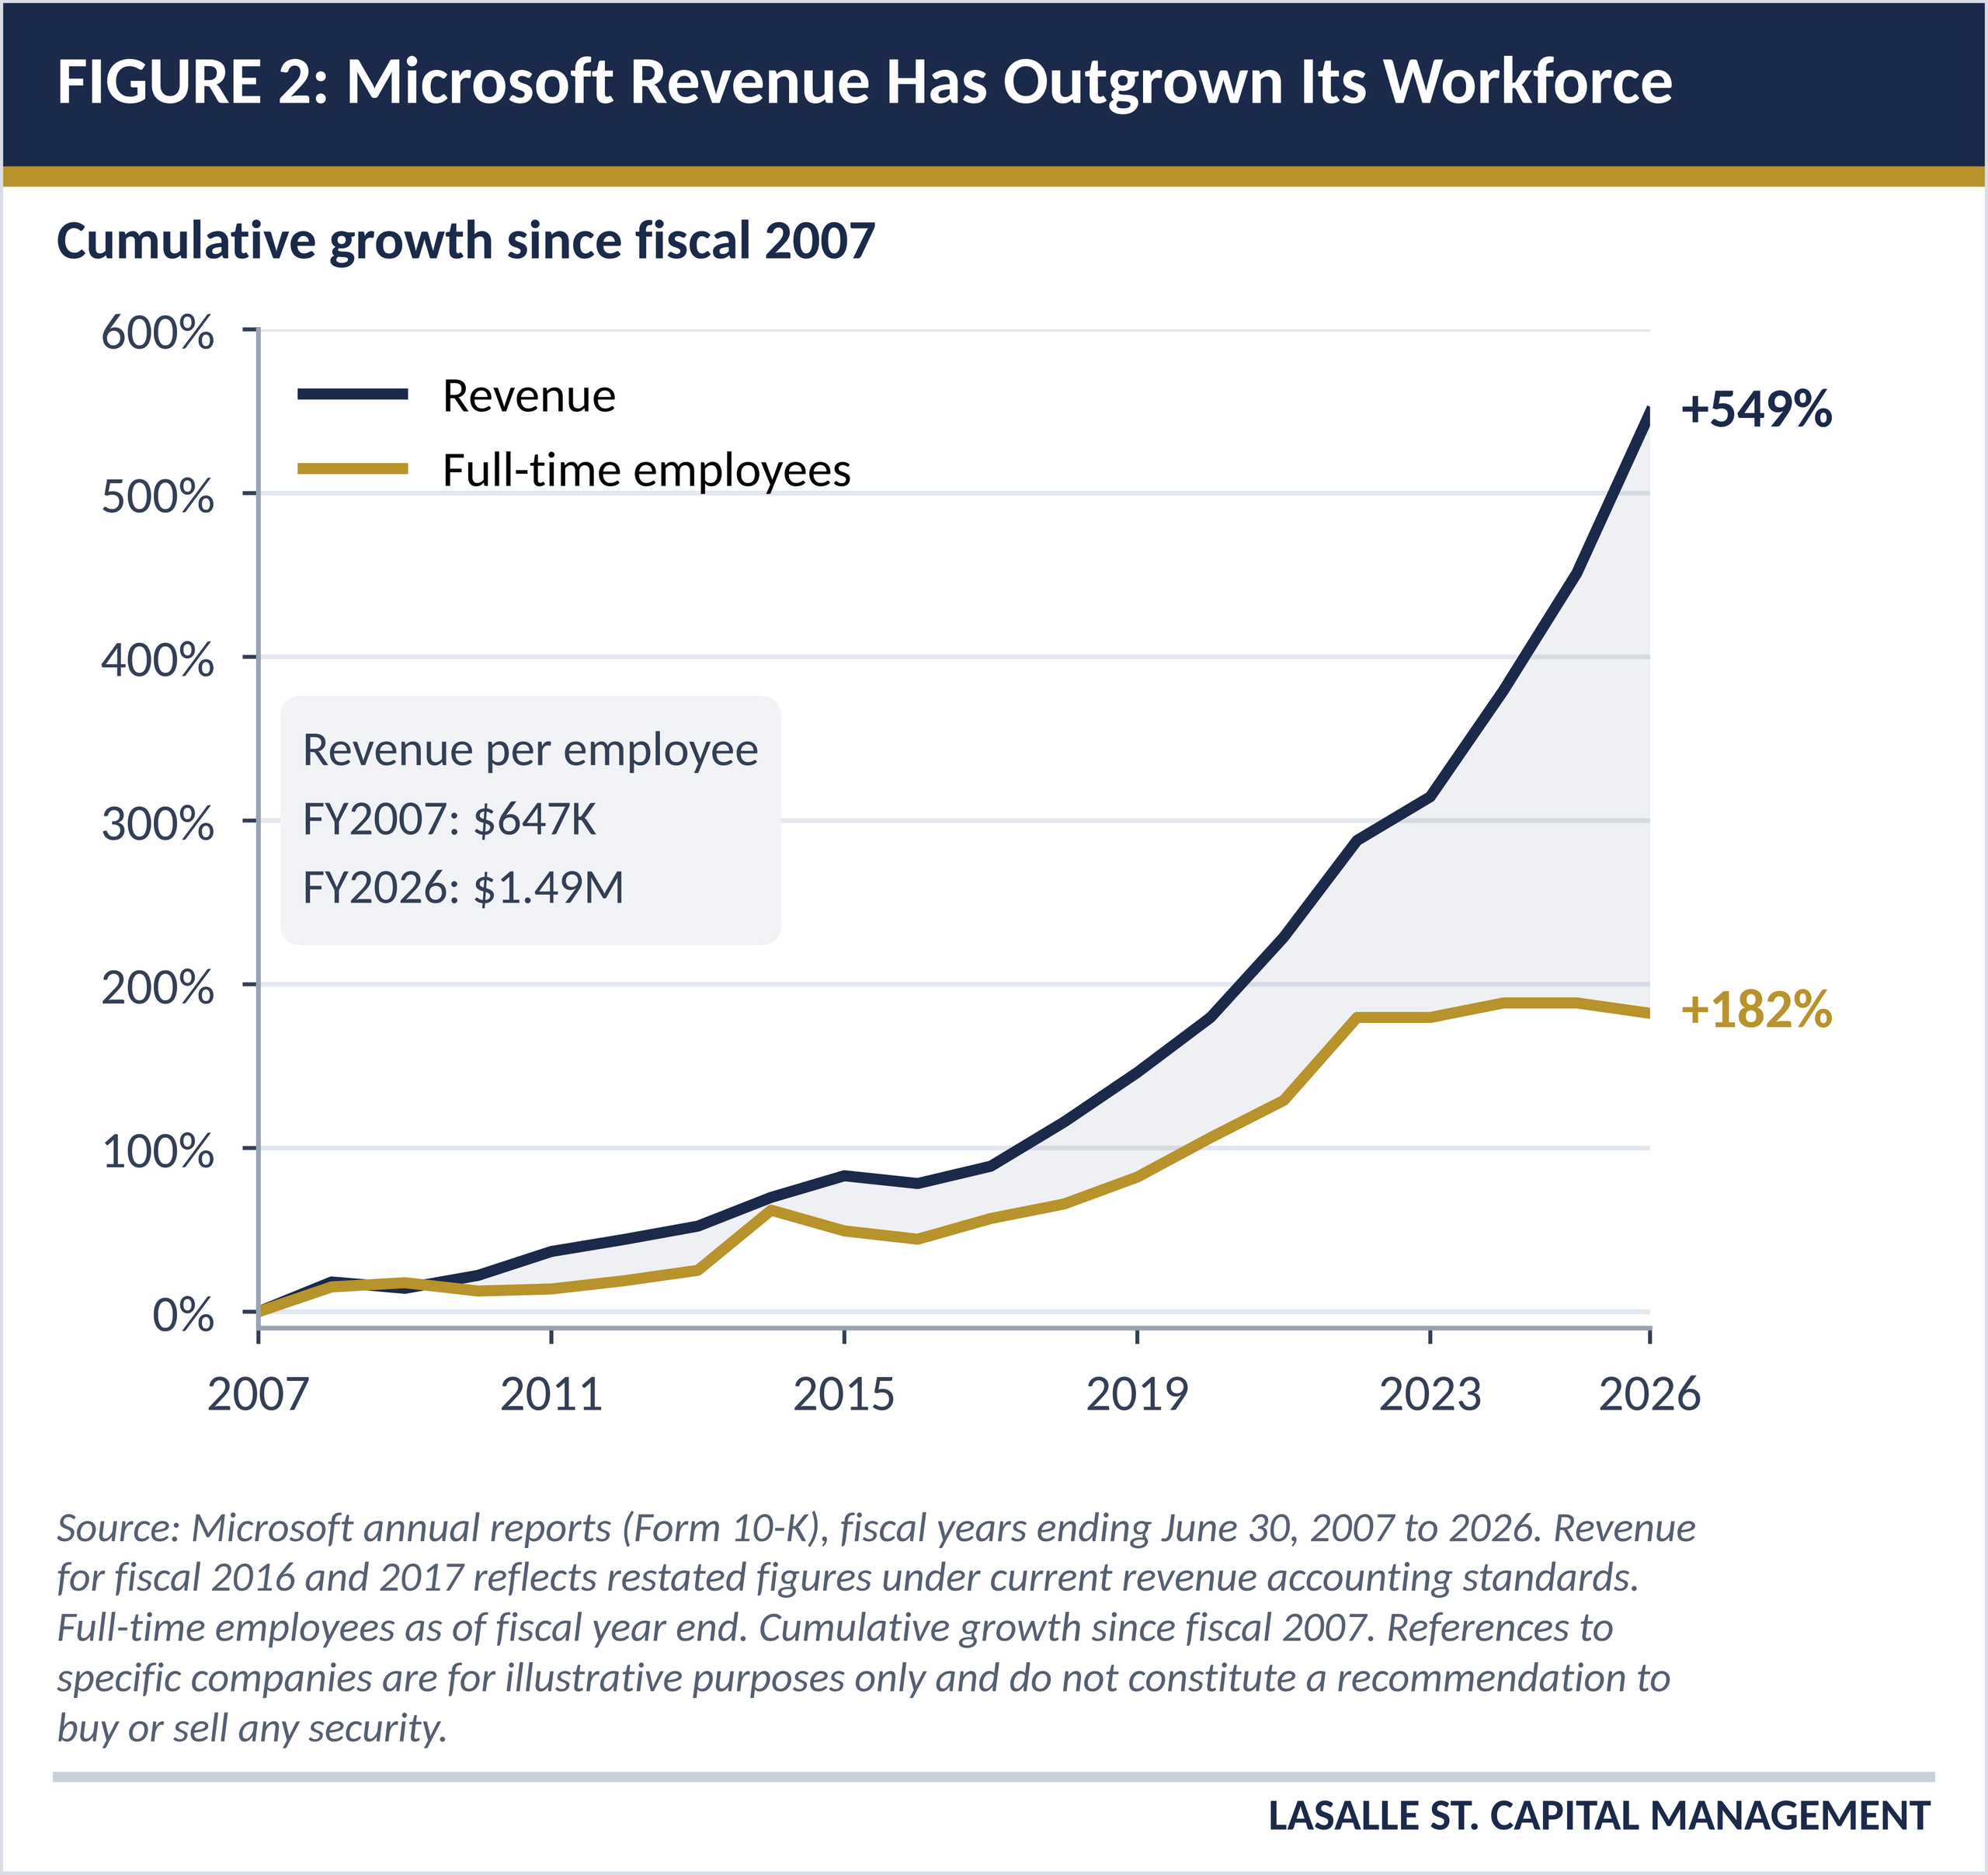
Microsoft illustrates the pattern at the company level (Figure 2). Since fiscal 2007, the company’s revenue has grown about 549%, while its full-time workforce has grown about 182%. Revenue per employee has risen from about $647,000 to roughly $1.49 million. Microsoft reported its first annual headcount decline since 2016 in fiscal 2026, and Bloomberg reported in late October that the company plans to offer voluntary buyouts to roughly a quarter of its workforce.3 The company has said that eliminated roles are not being replaced by AI, while acknowledging that AI is changing how work gets done.
The evidence should be kept in perspective. The unemployment rate remains a relatively low 4.2%, and layoffs remain low by historical standards. Slower immigration has also reduced the number of new jobs needed to keep unemployment steady. Announced job cuts that employers attribute to AI totaled about 120,000 through September, roughly 21% of all announced cuts, but these figures reflect what employers say rather than measured cause and effect.4 Earlier waves of technology have tended to shift employment across industries over time rather than permanently reduce it.
The broader economy remains strong, which is what makes the hiring slowdown notable. Third-quarter GDP grew at a 3.4% annualized rate, led by consumer spending and AI-related business investment. Surveys of manufacturing and services activity remain in expansion territory, and initial jobless claims are near a two-year low. The strain is showing up in household budgets instead: inflation-adjusted consumer spending was flat in September, and the personal saving rate fell to its lowest level since 2022.1
The Wealth Pump
The pressure on paychecks is not new. Over the past 50 years, U.S. median household income has risen roughly sevenfold in nominal terms, about 4% per year, reaching $87,460 in 2025. After adjusting for inflation, however, the gain is only about one quarter, or roughly 0.5% per year.5 Over a similar period, output per hour has grown far faster than typical pay. From 1979 to 2022, net productivity rose 64.7%, while the inflation-adjusted hourly pay of typical workers rose 14.8% (Figure 3).6
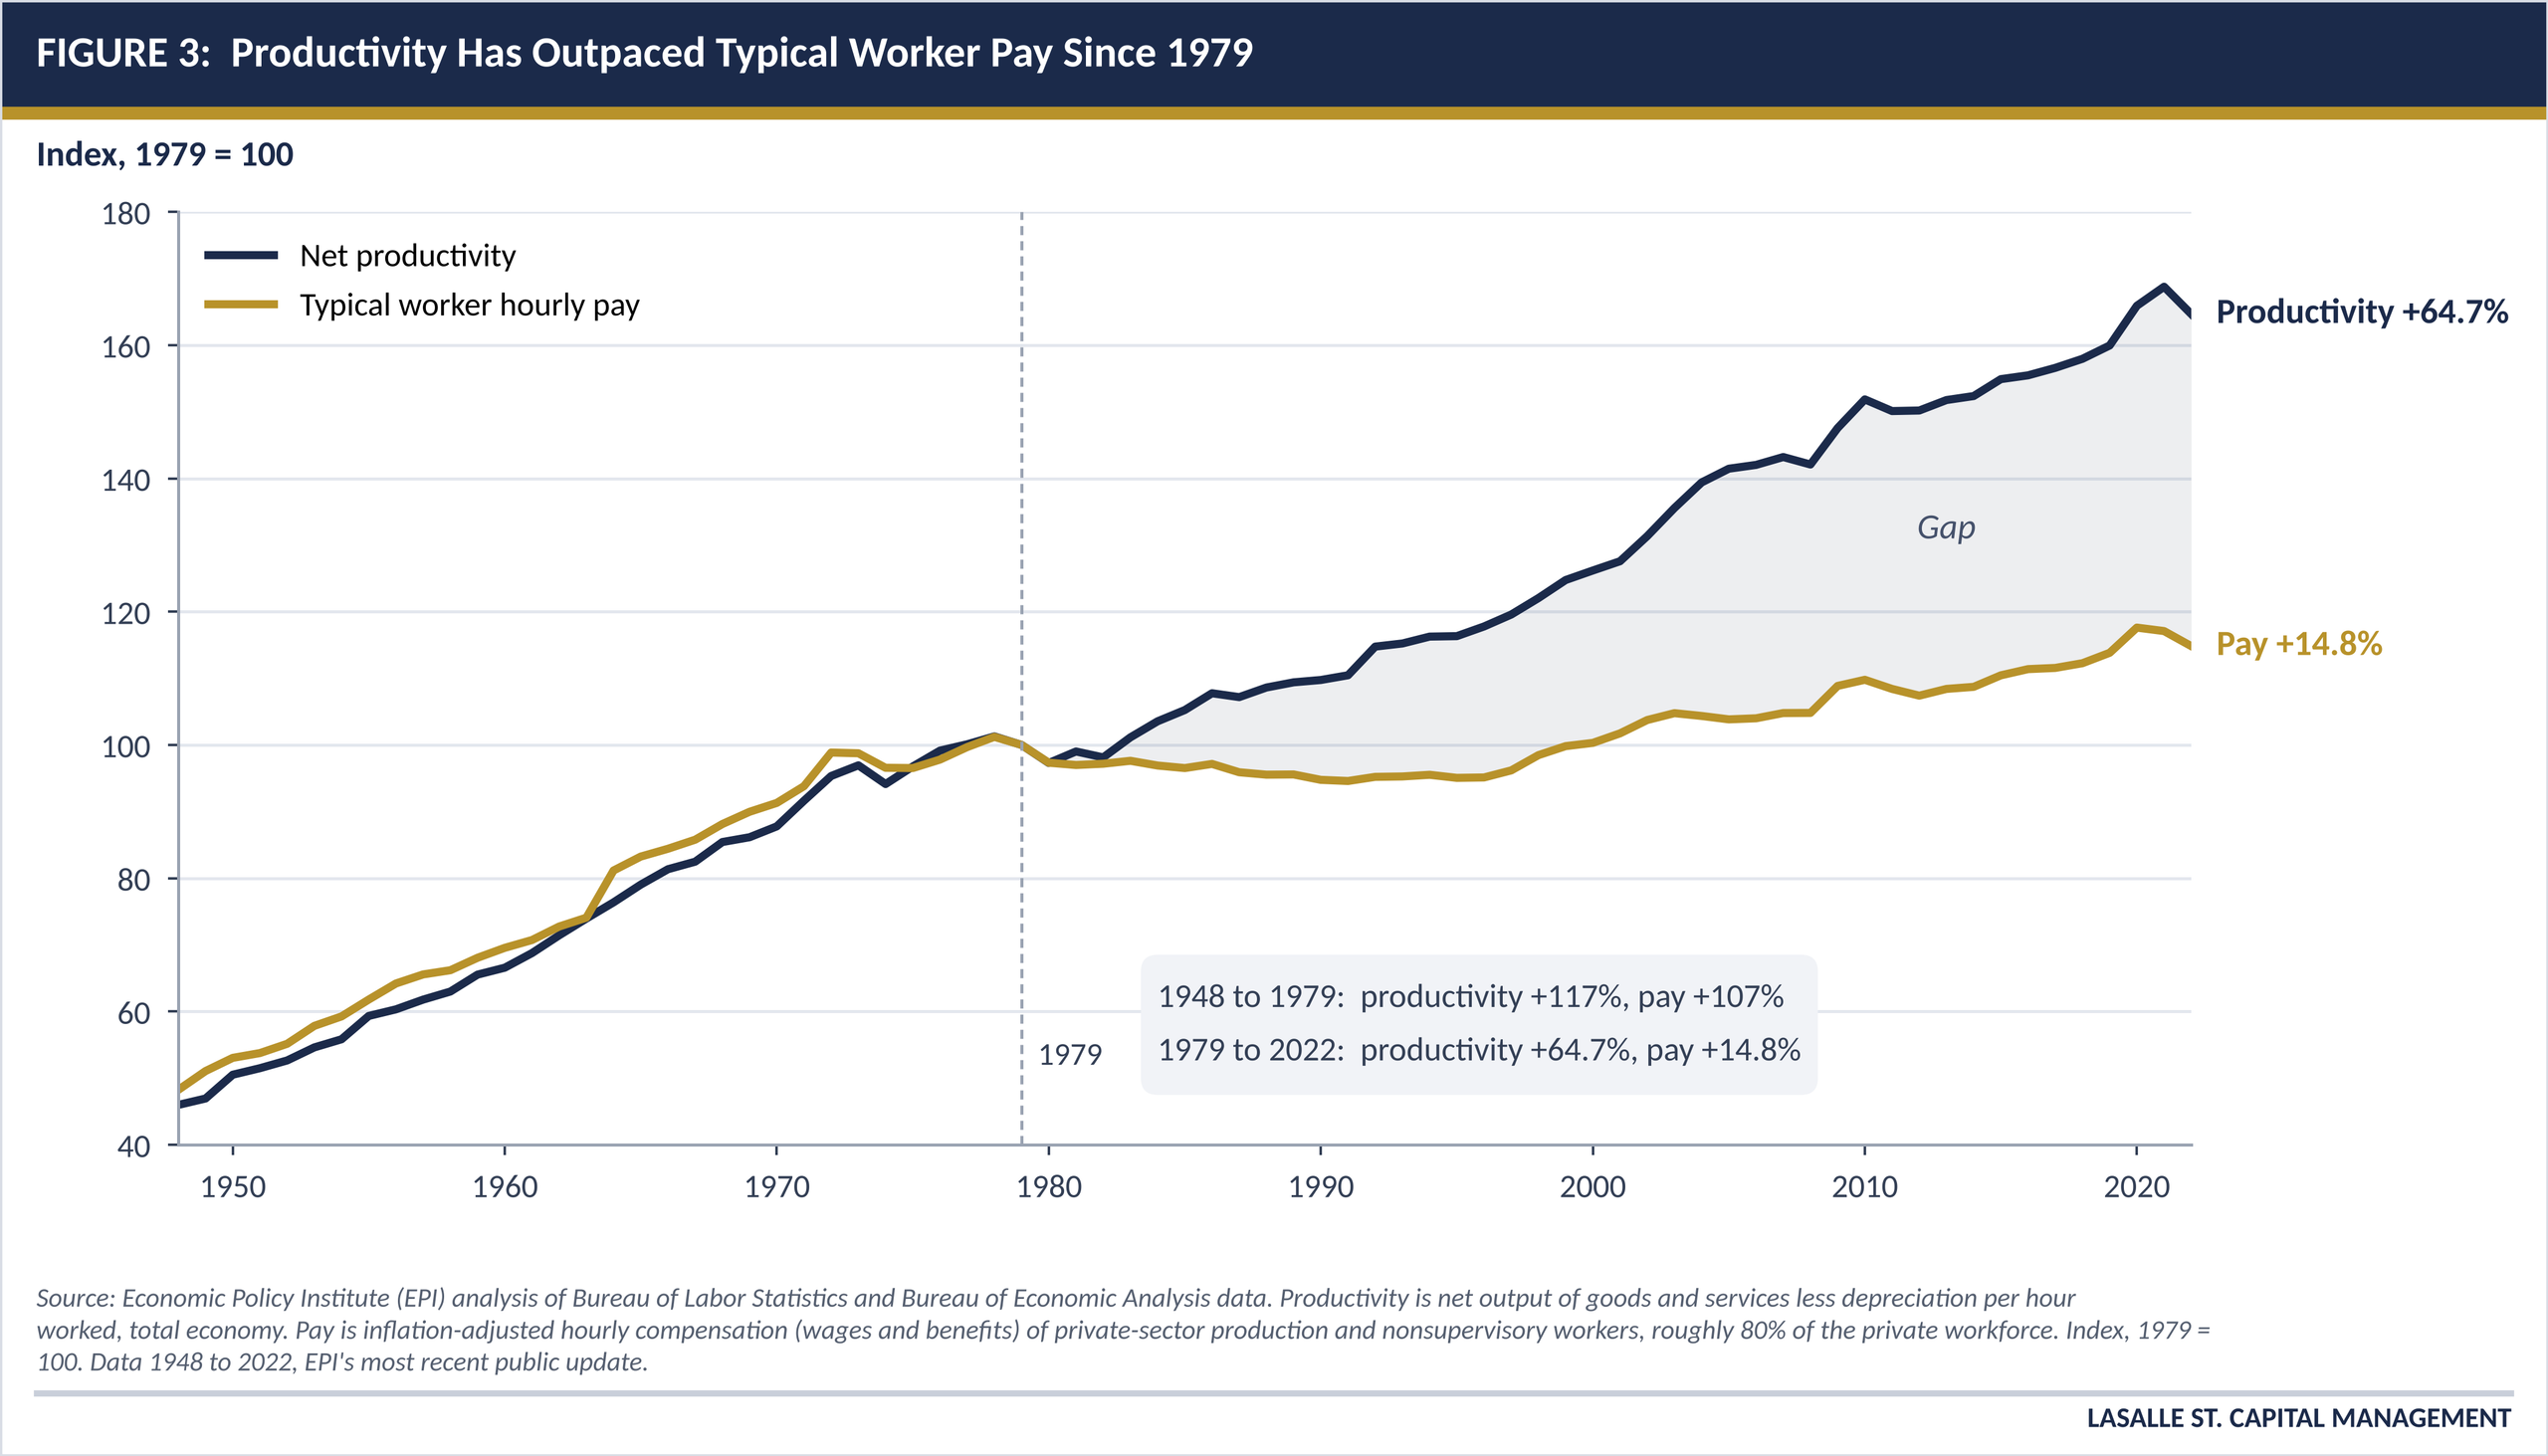
The typical household has captured a shrinking share of the productivity, income, and wealth it helps create. Historian Peter Turchin calls this dynamic the “wealth pump”: a gradual transfer of a society’s gains from ordinary workers toward a smaller group of elites, which he measures as the ratio of typical wages to economic output per person.7 AI could accelerate this trend if its gains flow mainly to the owners of capital rather than to workers.
Economists debate the size of this gap. The Economic Policy Institute, which compiles the data in Figure 3, attributes it largely to policy choices. Other researchers argue that the gap narrows when pay includes total compensation, such as employer-provided health insurance, and when productivity and pay are adjusted for inflation in the same way. Government transfers and tax credits also raise after-tax incomes for many households. Even so, most measures agree that a smaller share of national income now flows to labor than in past decades.
The Tax Base Follows the Paycheck
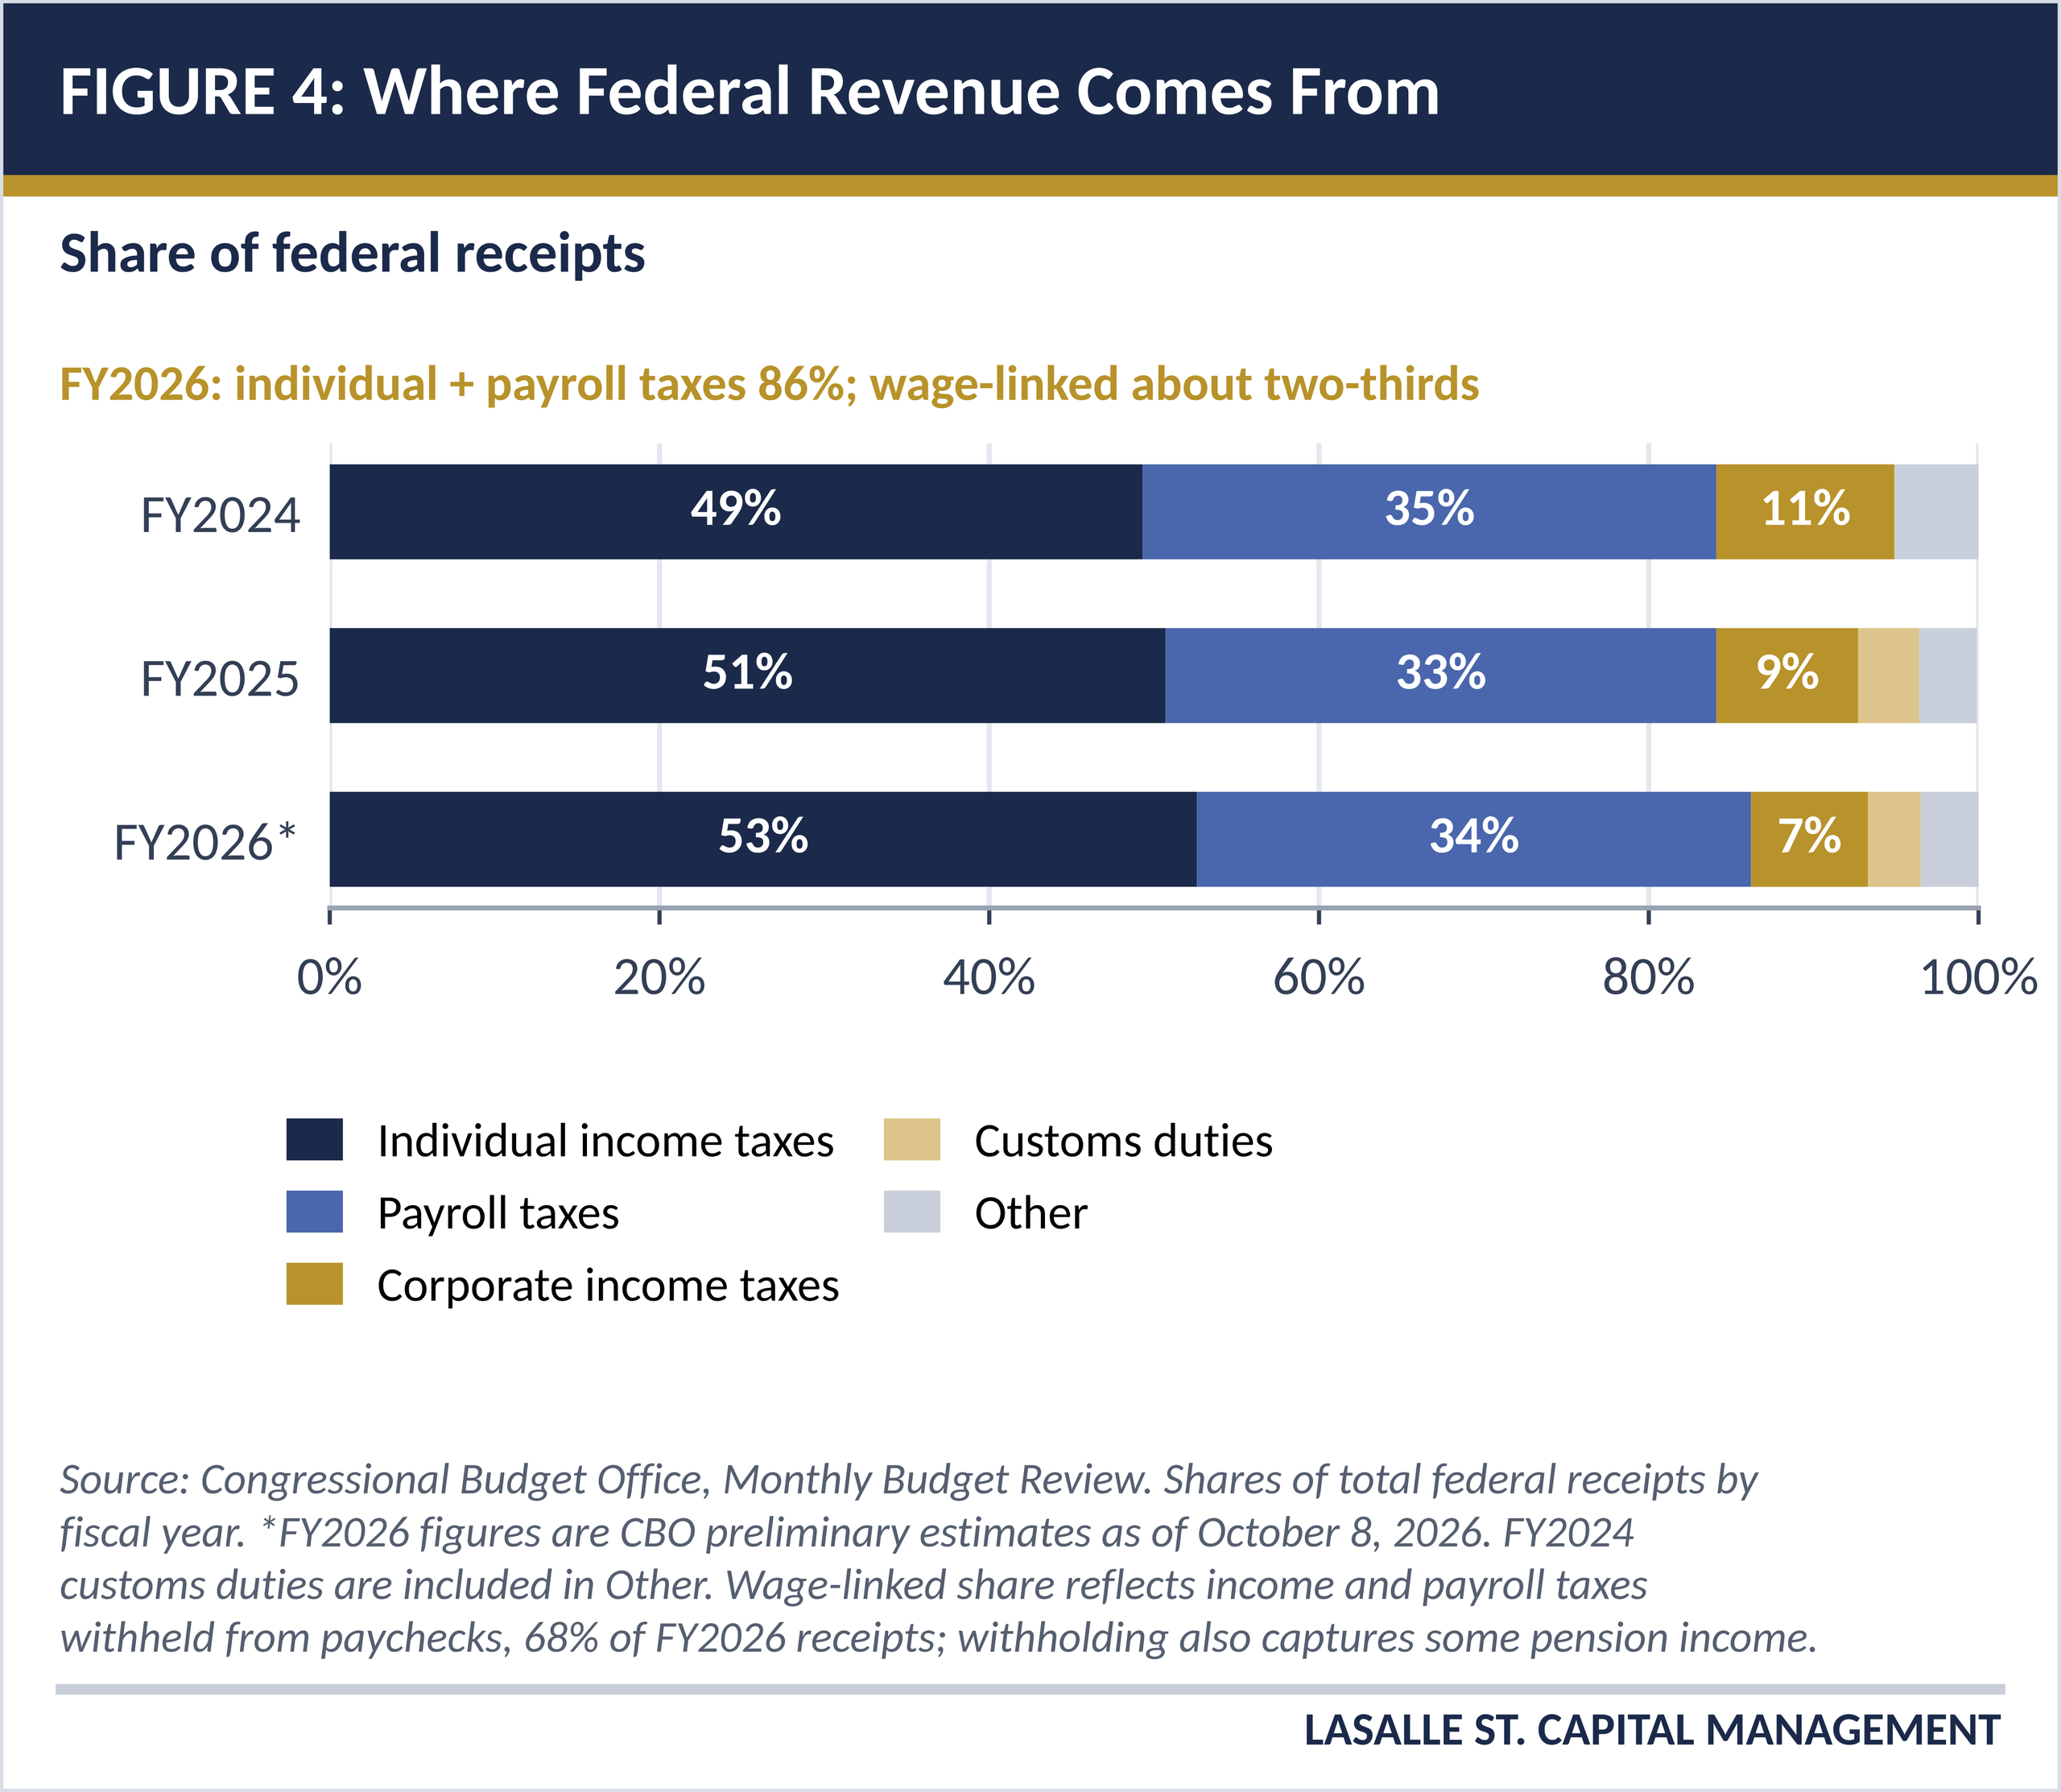
This shift matters for the federal budget because Washington depends heavily on paychecks. In fiscal 2026, individual income taxes and payroll taxes, which fund Social Security and Medicare, together accounted for about 86% of federal revenue (Figure 4).8 Not all of that is labor income, since individual income taxes also apply to capital gains, dividends, and interest. A narrower measure, taxes withheld from paychecks, equaled about 68% of federal revenue, and RAND estimates that roughly two-thirds of federal revenue comes directly from labor.9
When income shifts from wages to profits, the government typically collects less. Wages are subject to both income and payroll taxes, while corporate profits and investment gains are generally taxed at lower effective rates, and some are deferred or reduced by deductions. One academic estimate suggests that each dollar of income shifted from labor to capital reduces federal revenue by roughly 10 to 15 cents.10 The effect is already visible in corporate tax receipts, which fell 16% in fiscal 2026 to $382 billion even as corporate profits grew, largely because of larger deductions for business investment under the 2025 tax law.
The payroll tax base is the most exposed. The 2026 Social Security Trustees Report projects that the main Social Security retirement trust fund will be depleted in late 2032, after which incoming revenue would cover about 78% of scheduled benefits.11 Slower wage growth would bring that date closer and increase the likelihood that shortfalls are funded with additional Treasury borrowing.
What It Means for Treasuries
A jobless recovery pulls the Treasury market in two directions at once, and the net effect depends on the maturity of the bond.
Forces That Could Lower Yields
Weaker hiring and slower wage growth tend to restrain consumer spending and inflation. If energy prices ease and the labor market softens further, the Federal Reserve would have room to reverse its 2026 rate increases, which would most directly benefit shorter- and intermediate-term bonds. October offered a preview: as AI stocks sold off, investors bought Treasuries for safety and pulled the 10-year yield well below its early-month high. PIMCO research also finds that inflation-adjusted interest rates have tended to fall around major AI model releases, suggesting that investors may treat AI as a source of uncertainty that increases demand for safe assets.12
Forces That Could Keep Long-Term Yields Elevated
At the same time, a slower-growing labor tax base would add to deficits that are already large. The federal deficit was about $2.0 trillion in fiscal 2026, and the Congressional Budget Office projects that federal debt held by the public will rise from about 101% of the economy’s annual output today to 120% by 2036.13 Larger deficits require more Treasury issuance, and investors have been demanding more compensation to hold long-term bonds. The term premium, the extra yield investors require to hold a 10-year Treasury rather than rolling over short-term bills, reached about 0.9% in September, its highest level since 2014. Foreign official holdings of Treasuries have also declined this year, leaving more of the market to price-sensitive private buyers.14
Lessons From Past Jobless Recoveries
History offers a useful but imperfect guide. In the jobless recoveries that followed the 1991, 2001, and 2009 recessions, Treasury yields fell over the following two years, and short-term yields fell more than long-term yields, steepening the yield curve (Table 1).15 In each case, the Fed cut rates and held them low.
Table 1: Treasury Yields and the Yield Curve After Past Jobless Recoveries
| Recovery (24 months after recession end) | 10-year yield | 2-year yield | Curve slope (10-year minus 2-year) | Payroll change |
|---|---|---|---|---|
| March 1991 to March 1993 | -2.13% | -3.15% | +1.02% | +1.44 million |
| November 2001 to November 2003 | -0.35% | -0.85% | +0.50% | -0.66 million |
| June 2009 to June 2011 | -0.72% | -0.77% | +0.05% | +0.92 million |
Source: Federal Reserve Bank of St. Louis (FRED), monthly averages of 10-year and 2-year Treasury yields and nonfarm payrolls. Recession end dates from the National Bureau of Economic Research. Changes in percentage points. Past performance is no guarantee of future results.
Today’s starting point differs in important ways. Inflation is above the Fed’s target, the Fed has recently been raising rather than cutting rates, deficits are near 6% of GDP outside of a recession,13 and the term premium is rising rather than falling. In each past episode, both long-term yields fell and the yield curve steepened. For these reasons, we think the steepening is the part of that history more likely to repeat, while lower long-term yields are less assured this time.
The Midterms and Divided Government
The Economic Backdrop for Voters
Several economic pressures shaped the backdrop for this week’s midterm elections. We highlight them because they also bear directly on the outlook for inflation, interest rates, and consumer spending. Michael Cembalest of J.P. Morgan Asset Management recently compiled many of these trends, and we draw on his work below.16
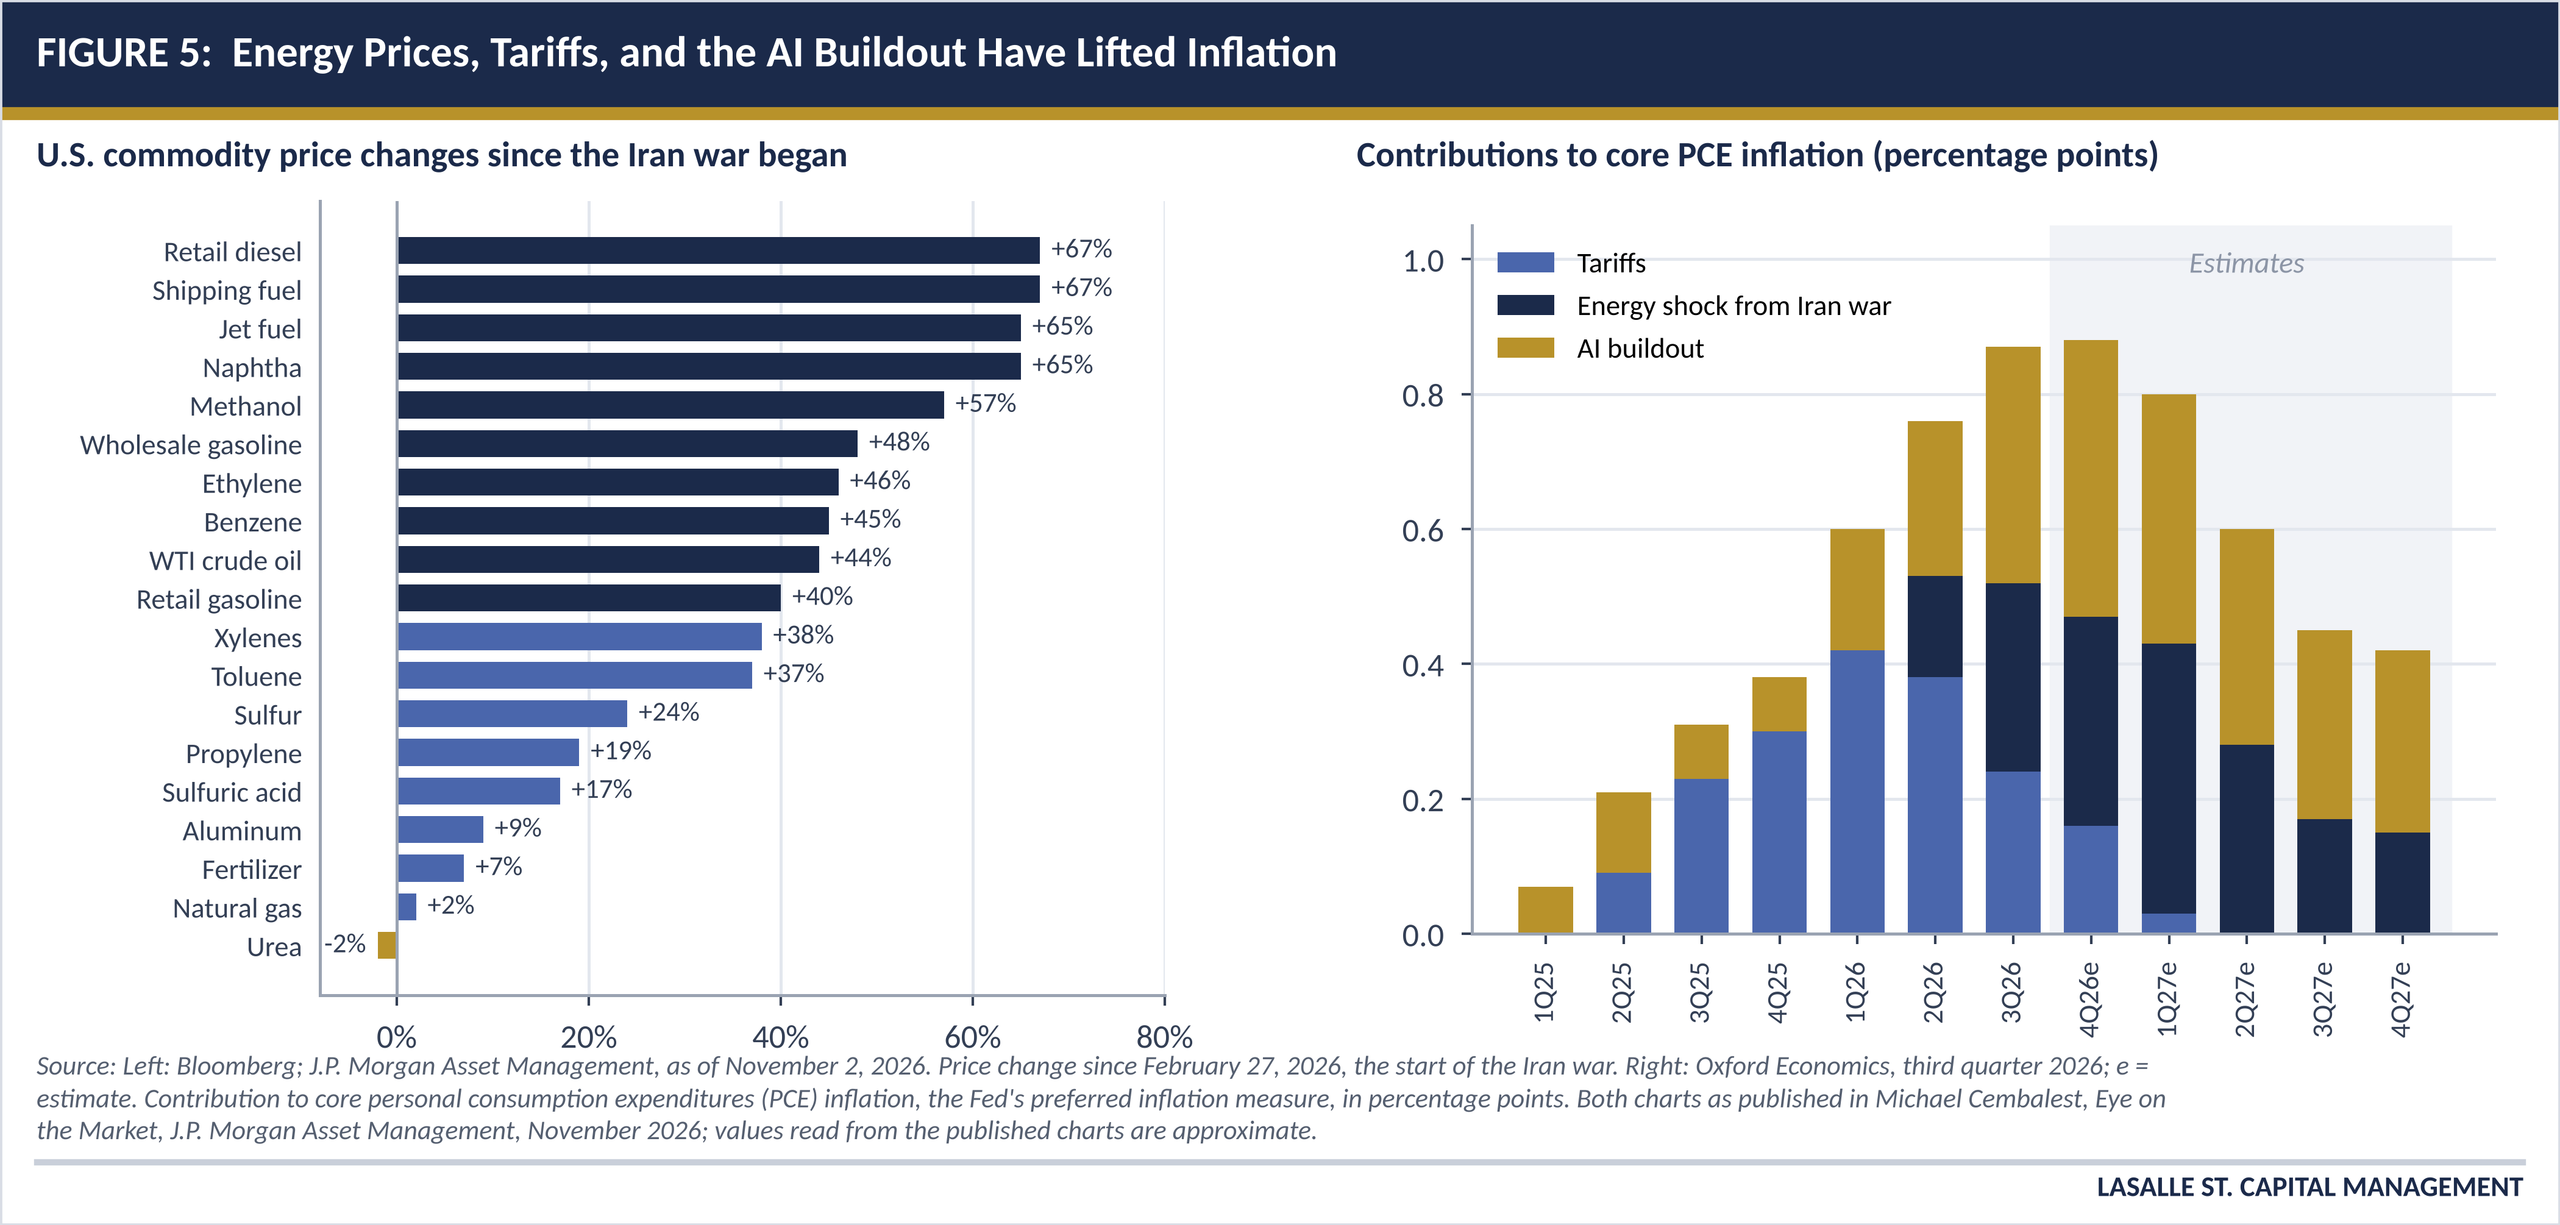
- Prices. Commodity prices have risen sharply since the Iran war began in late February. Retail diesel is up about 67%, jet fuel about 65%, crude oil about 44%, and retail gasoline about 40% (Figure 5). Oxford Economics estimates that tariffs, the energy shock, and the AI buildout together added nearly 0.9 percentage point to core inflation in the third quarter, including indirect effects as higher energy costs passed through to other goods and services, with the effect expected to fade gradually through 2027.
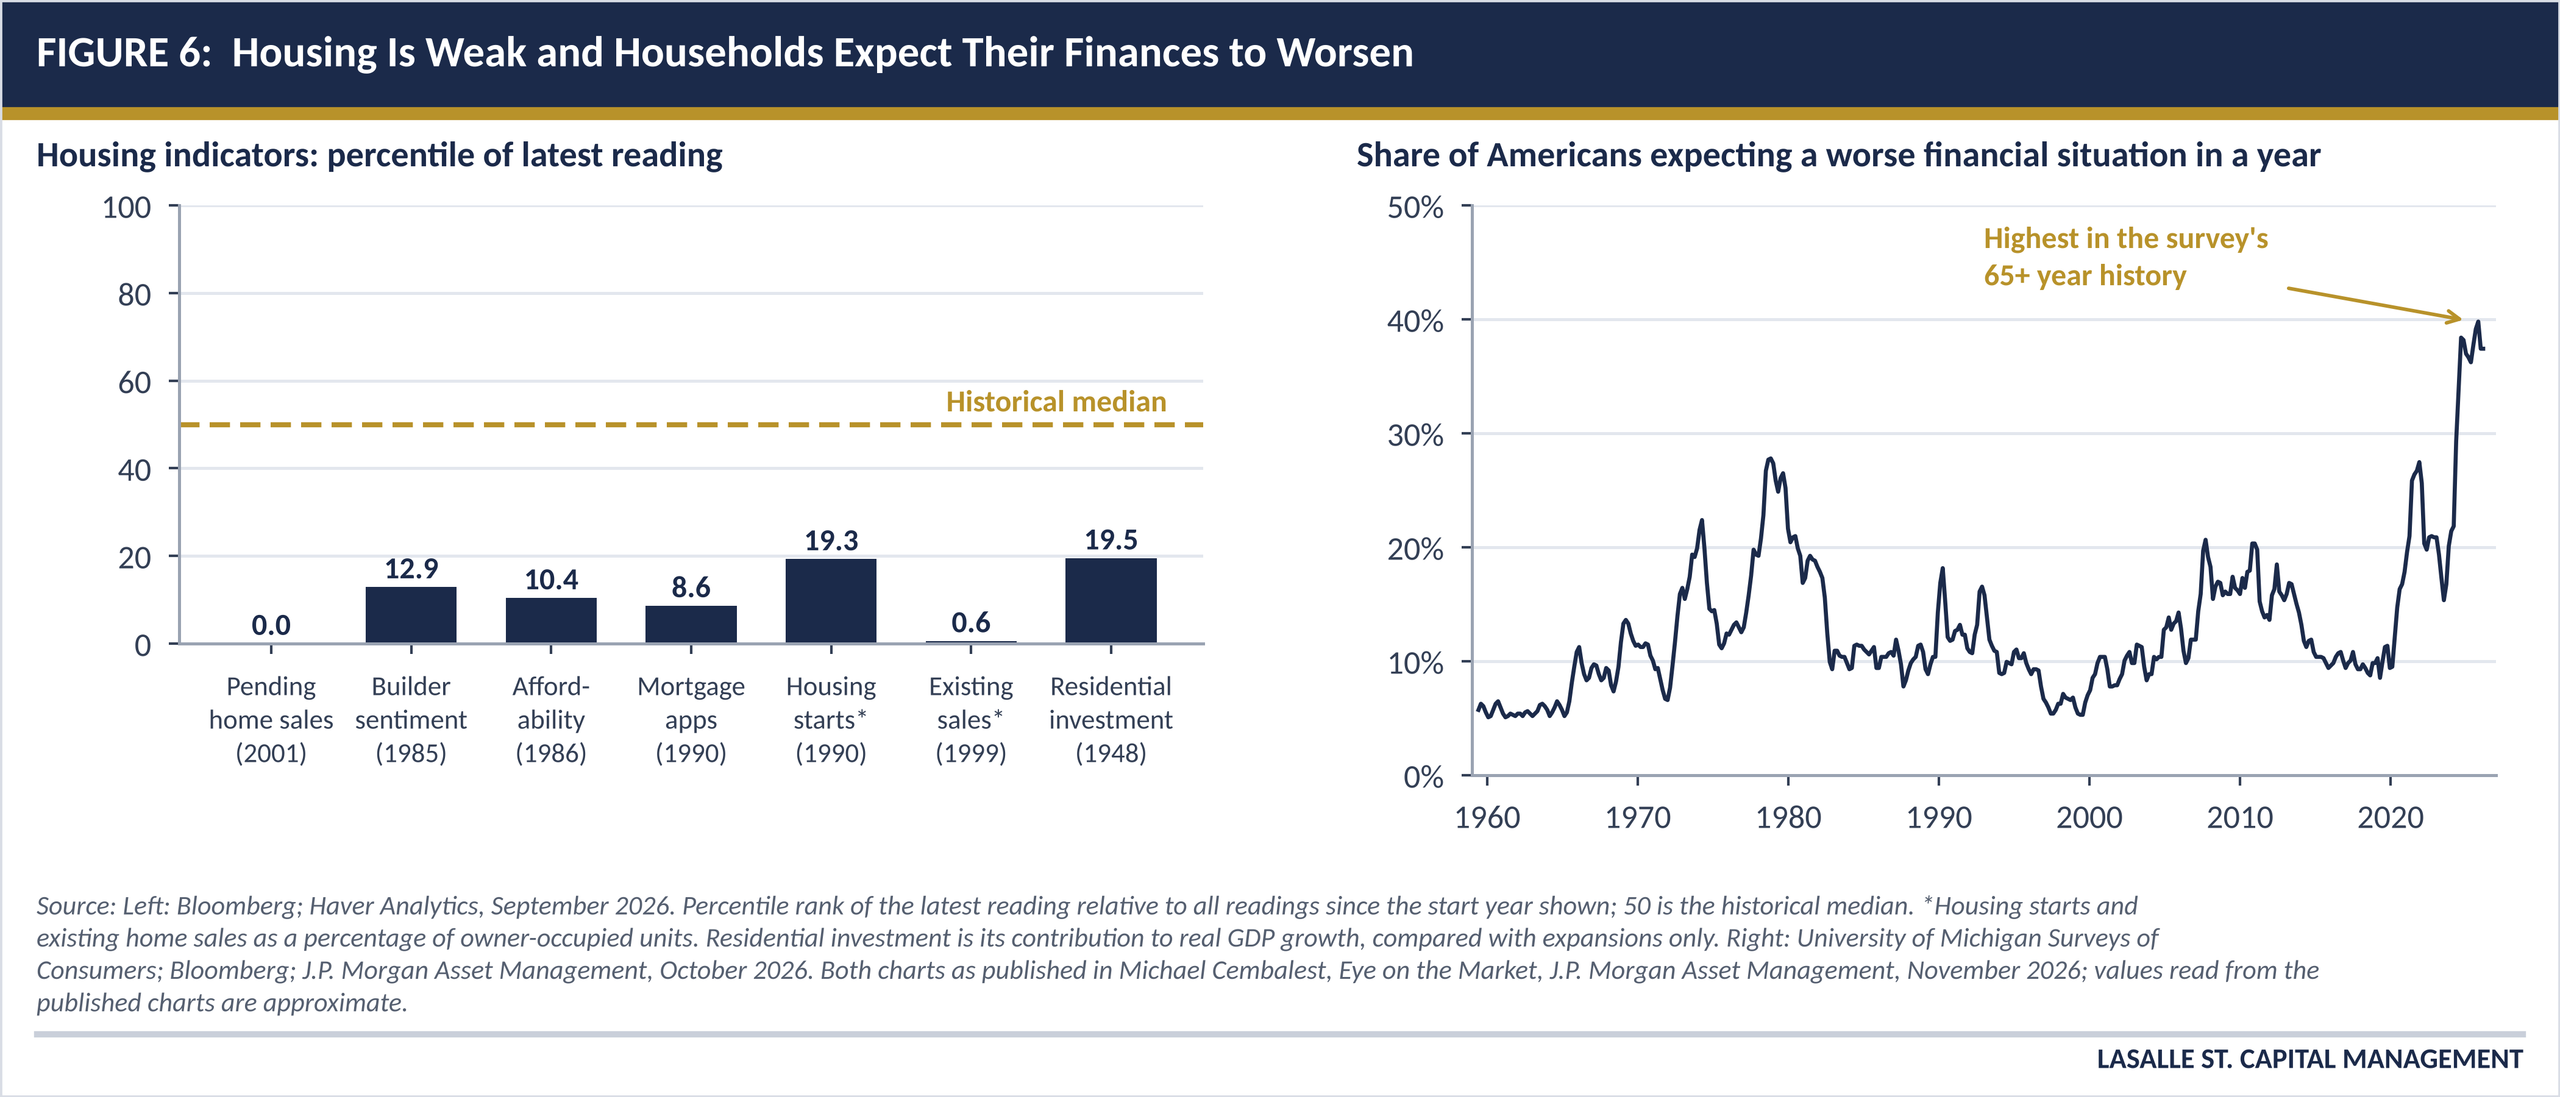
- Housing. Home affordability, homebuilder sentiment, mortgage applications, and home sales all sit in the bottom fifth of their historical ranges, and pending home sales are at their lowest level since at least 2001 (Figure 6).
- Household finances and spending. The share of Americans who expect their financial situation to be worse a year from now is the highest in more than 65 years of survey data. Consumer confidence is among the lowest on record, and households in the top 10% of the income distribution account for roughly half of consumer spending, which leaves overall spending sensitive to swings in stock and home prices.
- Health care costs. Premiums for Affordable Care Act marketplace plans have risen sharply, and private health insurance costs are climbing, partly as providers offset lower public reimbursement rates and more uncompensated care.
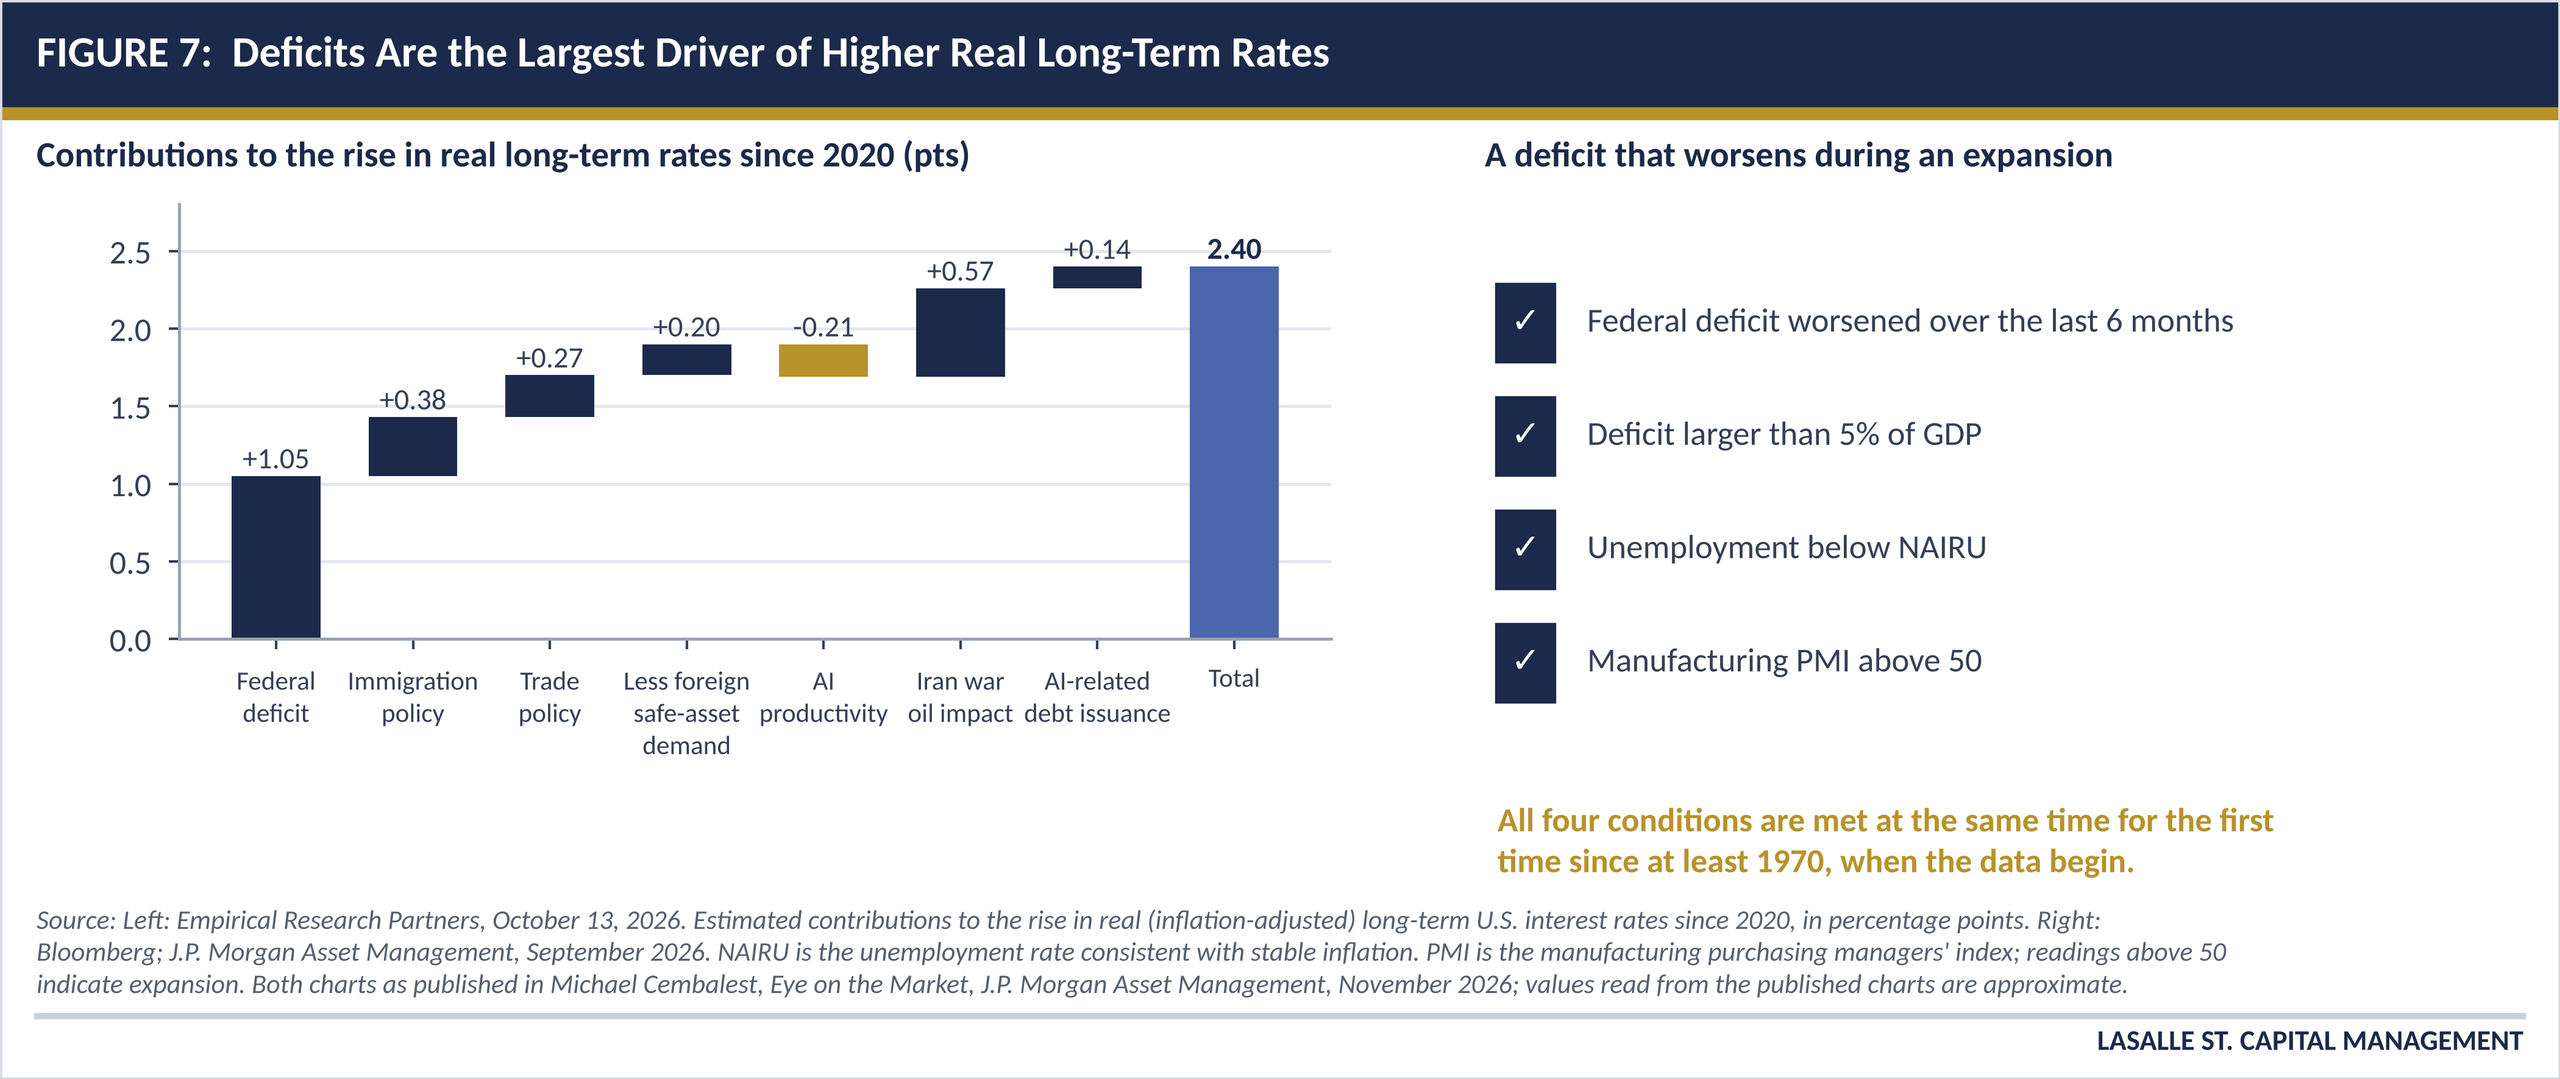
- Interest rates and deficits. The Fed has raised its policy rate this year, and long-term rates have climbed. Empirical Research Partners estimates that the federal deficit accounts for about 1 percentage point of the roughly 2.4 percentage point rise in inflation-adjusted long-term rates since 2020, the largest single factor (Figure 7). The deficit is also worsening during an economic expansion, a combination that has not occurred since at least 1970.
These pressures matter for investors regardless of which party controls Congress. Elevated energy, housing, and health care costs weigh on household budgets, and, alongside the labor market trends described earlier, they leave consumer spending more dependent on higher-income households. A deficit that widens during an expansion also adds to the supply pressures on long-term Treasury yields described above (Figure 7).
What Divided Government Has Meant for Treasuries
Democrats won control of both the House and the Senate, according to results from The Associated Press as of November 6, creating divided government with a Republican administration. Democrats and the independents who caucus with them hold at least 54 Senate seats, and Democrats have won at least 253 House seats, with some races still undecided.17 In our view, with control of Congress and the White House now split, major new tax or spending legislation is less likely over the next two years. So is significant deficit reduction, which leaves the long-term fiscal path largely unchanged. Near-term attention will turn to upcoming government funding deadlines.
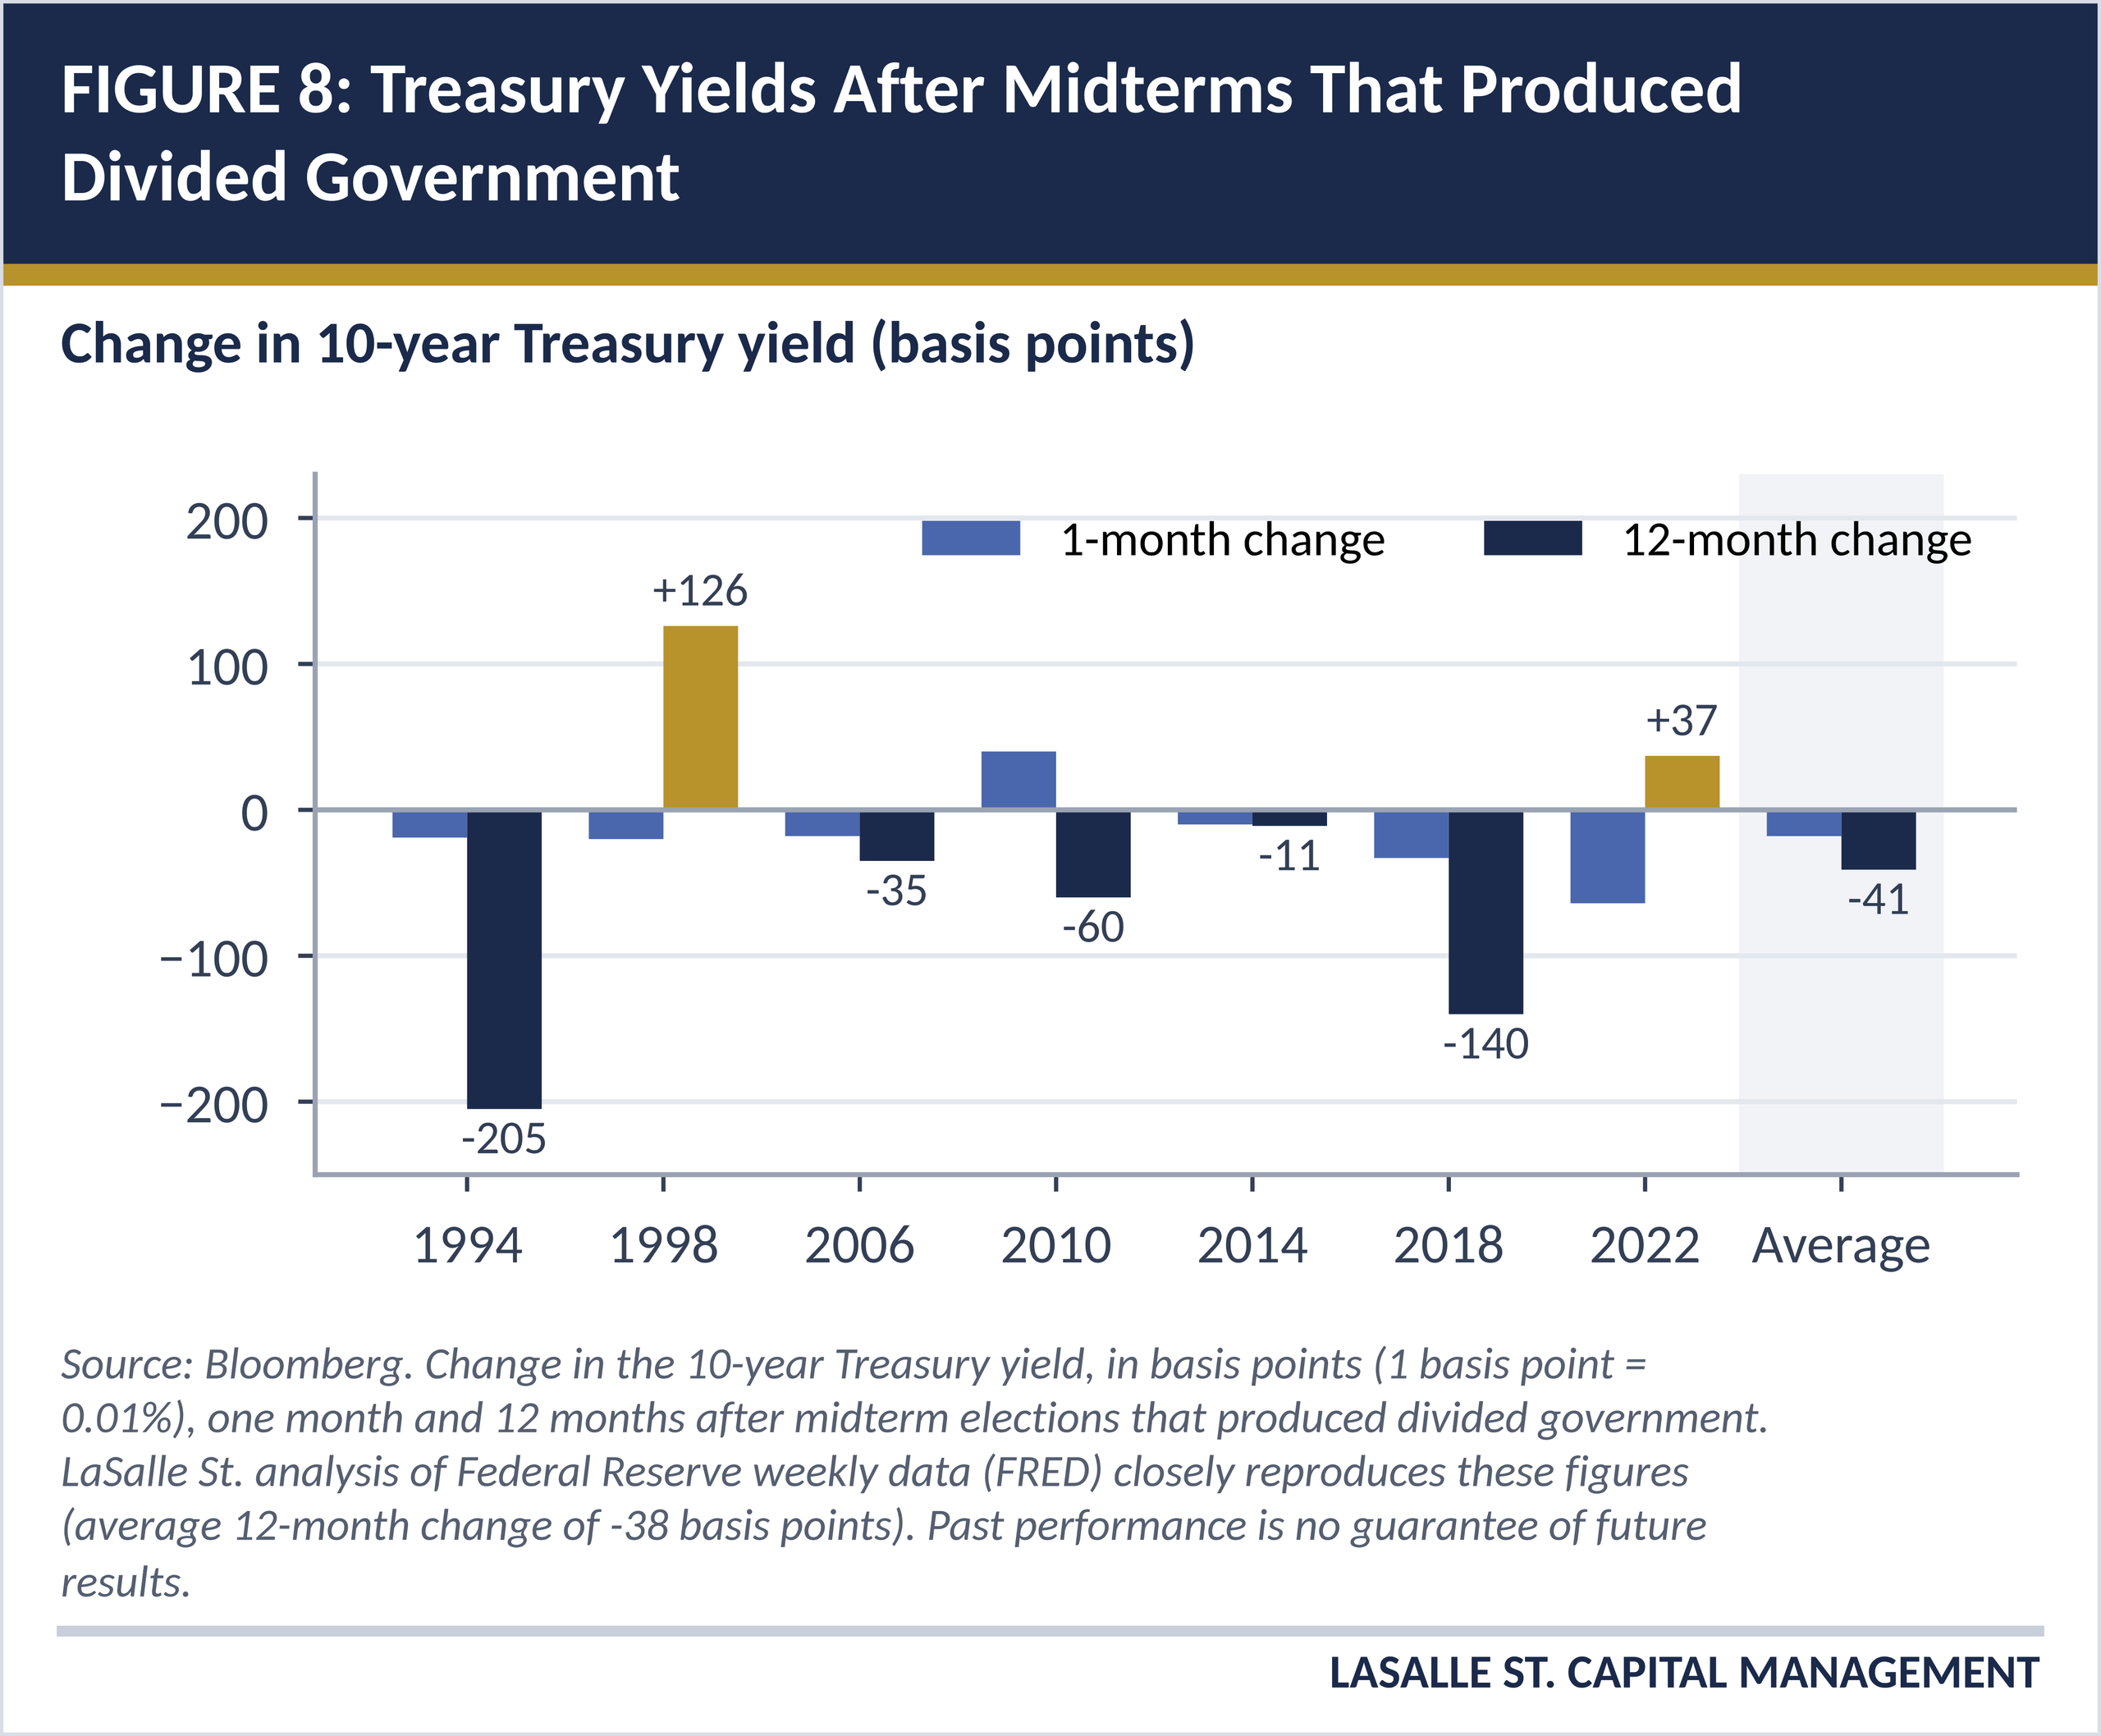
History offers some perspective for bond investors. When midterms have produced divided government, the 10-year Treasury yield has fallen by an average of about 18 basis points (0.18%) over the following month and about 41 basis points over the following year (Figure 8).18 One explanation is that divided government tends to limit new fiscal spending. The record is mixed, however. Yields rose over the following year in 1998 and 2022, and two years, 1994 and 2018, account for most of the average decline.
Outlook and Portfolio Positioning
Near Term: Patience and Caution
In our view, near-term market signals call for patience. The S&P 500 finished October 3.0% below its record high. It sits below its 50-day moving average but above its 200-day moving average, so the short-term trend has weakened while the long-term uptrend remains intact. Market breadth, the share of stocks participating in gains, improved, but utilities led the improvement, a sign of investors seeking safety. The VIX, a measure of expected stock market volatility, rose to 19.4 from about 15, and investor sentiment weakened.1 At the same time, asset managers have reduced their stock market exposure, which suggests crowded positioning is less of a concern, and equity funds continued to see steady inflows. Investors appear to be reducing risk without the broad selling that often marks a market bottom. With growth strong and inflation elevated, the Fed has little reason to cushion a weaker stock market, and a clear cooling in November’s inflation data would likely be needed to keep the Fed from raising rates in December, although further softening in the labor market could also give policymakers reason to wait.
Longer Term: A Steeper Yield Curve
Our base case is a low-hire expansion with solid productivity growth. In that environment, we would expect shorter-term yields to decline once the Fed has room to ease, while supply pressures and a rising term premium keep longer-term yields elevated. The result would be a yield curve that steepens further from its relatively modest slope in late October, when the 10-year yield was about 0.26 percentage point above the 2-year yield.
Two alternative scenarios deserve equal attention. In a more favorable scenario for bonds, energy inflation fades, the labor market weakens more noticeably, and the Fed cuts rates, allowing yields to decline across maturities. In a less favorable scenario, deficits run above projections and foreign demand continues to soften, keeping long-term yields at or above 5% even as the Fed eventually eases.
Positioning
At its November meeting, the Investment Committee became incrementally more cautious and reduced tactical equity beta exposure, meaning the portion of our portfolios positioned to move with the broad stock market. Consistent with our rules-based process, we reduced core U.S. large-cap stock exposure in our model portfolios, which brought our tactical equity overweight back to its strategic target, in line with the benchmark. As part of the same reduction in market sensitivity, we also trimmed U.S. small-cap stocks. The proceeds modestly increased our allocations to cash and ultra-short fixed income. These changes were implemented on early in the month. The change reflects the near-term signals described above: a weaker short-term trend in the S&P 500, defensive market leadership, and wider spreads among the lowest-rated bonds. It is a modest adjustment rather than a change in our long-term outlook. The fundamental backdrop remains constructive: earnings growth is strong, valuations have moderated, and higher starting yields give bonds more income than in much of the past decade.
Our broader positioning continues to reflect the changes made at the October Investment Committee meeting. We maintain a shorter duration stance in core bonds, meaning interest rate sensitivity in line with the benchmark, and hold ultra-short fixed income sleeves in both tax-aware and non-tax-sensitive strategies. Those sleeves earn income near the Fed’s policy rate with limited sensitivity to interest rate changes, and they preserve flexibility to extend maturities if labor market conditions weaken further. Within fixed income, we favor short- and intermediate-term bonds over the longest maturities, where fiscal risks are most concentrated. Within equities, our tilt toward quality-oriented growth companies with strong balance sheets and consistent earnings fits a market that now rewards companies able to fund investment from their own cash. Our diversified commodities allocation provides broader exposure to inflation risks, including energy.
Important Disclosures
Securities are offered through LaSalle St. Securities, LLC (LSS), member FINRA/SIPC. Advisory services offered through LaSalle St. Investment Advisors, LLC, a Registered Investment Advisor affiliated with LSS. This material has been prepared by LaSalle St. Securities, LLC and/or its affiliated registered investment adviser. As such, the firm and its affiliates have a financial interest in providing investment advisory and brokerage services. This creates a conflict of interest, as the firm or its affiliates may benefit financially if a reader chooses to engage their services. The views expressed may reflect the interests of the firm and its affiliates and should not be viewed or relied upon as independent or impartial research or analysis. This material is intended for a broad audience and does not consider the specific investment objectives, financial situation, or needs of any individual.
LaSalle St. Capital Management is a trade name of LaSalle St. Investment Advisors, LLC, a Registered Investment Advisor registered with the SEC. Advisory services are provided by LaSalle St. Investment Advisors, LLC
This document has been prepared solely for informational purposes only and is neither an offer to sell or solicitation to buy any security, nor should any content provided herein be construed as any type of recommendation or personalized investment advice for any security or investment strategy. The information published and opinions expressed are subject to change without notice. All opinions and estimates constitute the author’s judgment as of the date of this report, and do not represent the opinions of LaSalle St. Securities, management, employees, or financial advisors. While the information comes from sources believed to be reliable LaSalle St. Securities does not guarantee nor make any representation, either expressed or implied, that the information and opinions expressed are timely, accurate, complete or up to date. Nothing contained constitutes financial, legal, tax, or other advice, nor should any business, financial, investment or any other decisions be made solely based on content. Any investment strategy discussed herein may not be suitable for everyone. Each investor needs to review an investment strategy for his or her own particular situation before making any investment decision. Past performance is no guarantee of future results and the opinions presented cannot be viewed as an indicator of future performance. Reliance upon any such information or opinion is at your own risk. LaSalle St. Securities’ clients are advised to consult with their financial advisor or registered representative prior to investing. With the exception of specified certificates of deposit, investments are NOT guaranteed by the FDIC.
The information and opinions provided herein are provided as general market commentary only and are subject to change at any time without notice. This commentary may contain forward-looking statements that are subject to various risks and uncertainties. None of the events or outcomes mentioned here may come to pass, and actual results may differ materially from those expressed or implied in these statements. No mention of a particular security, index, or other instrument in this report constitutes a recommendation to buy, sell, or hold that or any other security, nor does it constitute an opinion on the suitability of any security or index. The report is strictly an informational publication and has been prepared without regard to the particular investments and circumstances of the recipient.
Past performance does not guarantee or indicate future results. Any index performance mentioned is for illustrative purposes only and does not reflect any management fees, transaction costs, or expenses. Indexes are unmanaged, and one cannot invest directly in an index. Index performance does not represent the actual performance that would be achieved by investing in a fund
Performance information and source.
Past performance does not guarantee future results. The performance information shown herein is based on total returns with dividends reinvested and does not reflect the deduction of advisory and/or other fees normally incurred in the management of a portfolio.
Stock performance and fundamental data is based on the following instruments: SPDR S&P 500 ETF (SPY), SPDR Dow Jones ETF (DIA), iShares Russell 2000 ETF (IWM), iShares Russell 1000 Growth ETF (IWF), iShares Russell 1000 Value ETF (IWD), iShares MSCI EAFE ETF (EFA), iShares MSCI Emerging Markets ETF (EEM), Invesco QQQ Trust (QQQ).
Fixed Income performance is based on the following instruments: iShares Core U.S. Aggregate Bond ETF (AGG), iShares Investment Grade Corporate ETF (LQD), iShares National Muni Bond ETF (MUB), iShares High Yield Corporate ETF (HYG).
Fixed Income yields and key rates are based on the following instruments: Bloomberg US Aggregate, ICE BofA US Corporate, ICE BofA US Municipal Securities, ICE BofA US High Yield, 2 Year US Benchmark Bond, 10 Year US Benchmark Bond, 30 Year US Benchmark Bond, 30 Year US Fixed Mortgage Rate, US Prime Rate.
Commodity prices are based on the following instruments: Crude Oil WTI (NYM $/bbl), Gasoline Regular U.S. Gulf Coast ($/gal), Natural Gas (NYM $/mmbtu), Propane (NYM $/gal), Ethanol (CRB $/gallon), Gold (NYM $/ozt), Silver (NYM $/ozt), Copper NYMEX ($/lb), U.S. Midwest Domestic Hot-Rolled Coil Steel (NYM $/st), Corn (CBT $/bu), Soybeans (Chicago $/bu).
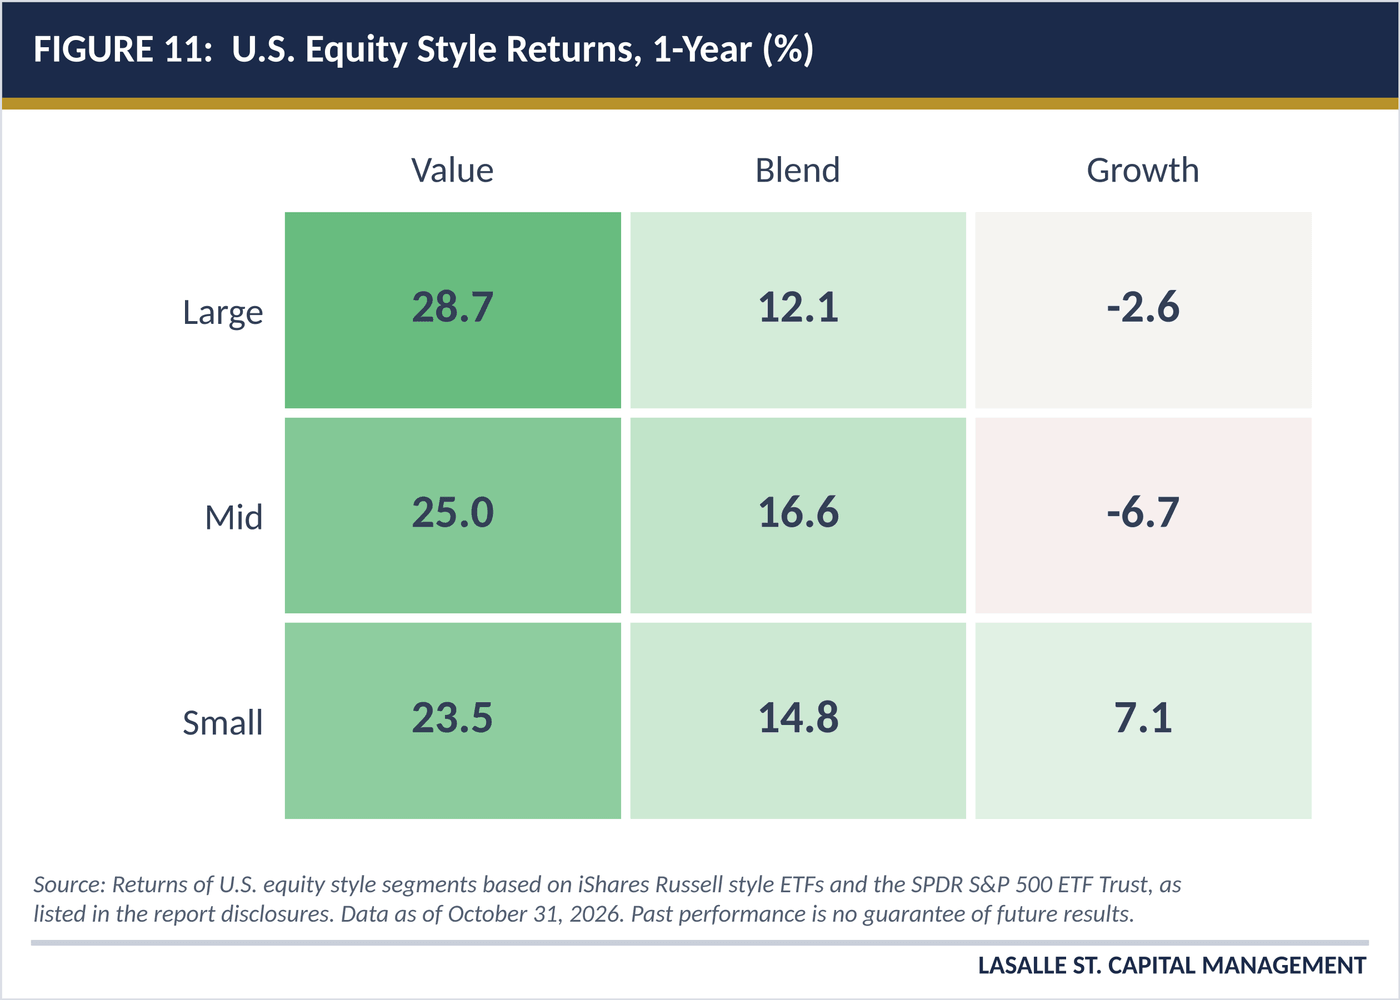
U.S. Style performance is based on the following instruments: iShares Russell 1000 Value ETF (IWD), SPDR S&P 500 ETF Trust (SPY), iShares Russell 1000 Growth ETF (IWF), iShares Russell Mid-Cap Value ETF (IWS), iShares Russell Midcap ETF (IWR), iShares Russell Mid-Cap Growth ETF (IWP), iShares Russell 2000 Value ETF (IWN), iShares Russell 2000 ETF (IWM), iShares Russell 2000 Growth ETF (IWO).
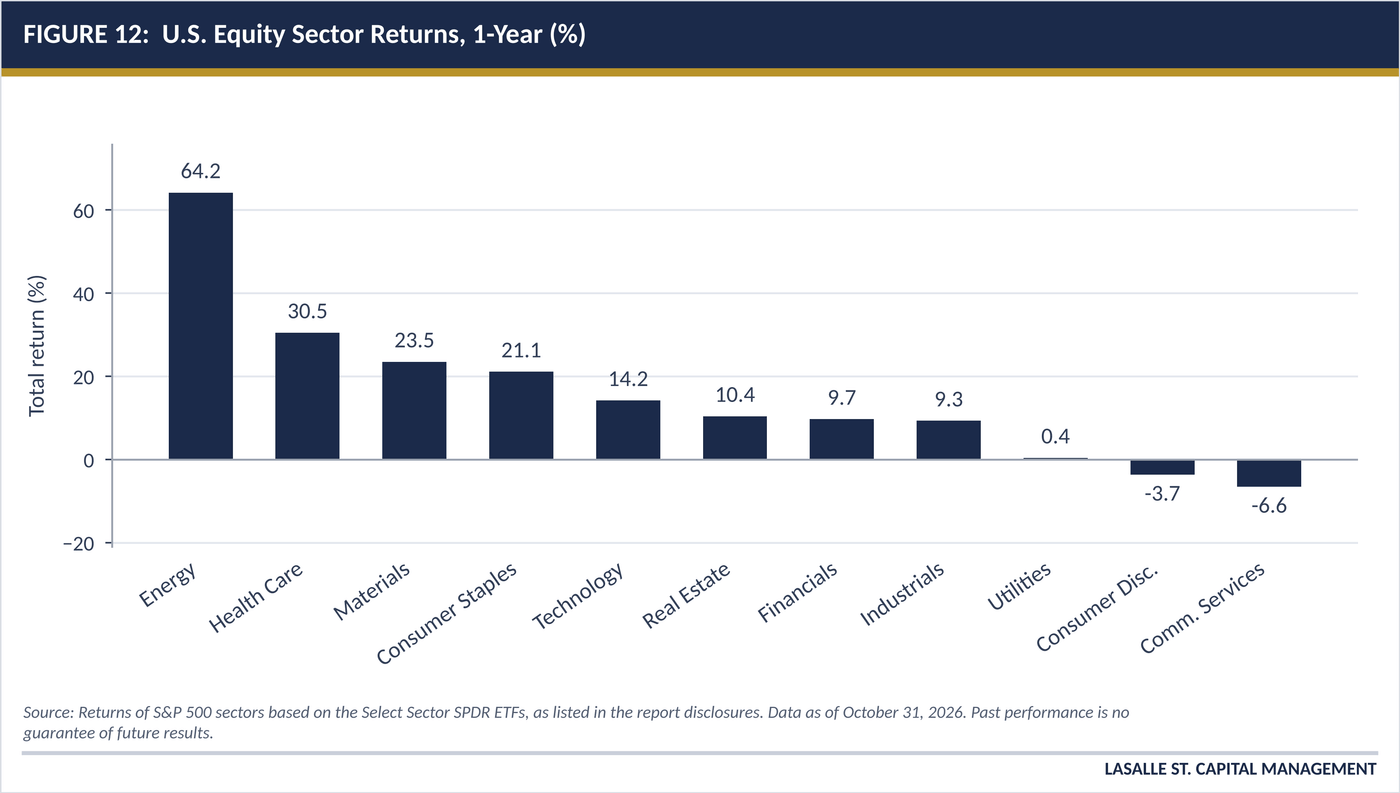
U.S. Sector performance is based on the following instruments: Consumer Discretionary Sector SPDR ETF (XLY), Consumer Staples Sector SPDR ETF (XLP), Energy Sector SPDR ETF (XLE), Financial Sector SPDR ETF (XLF), Health Care Sector SPDR ETF (XLV), Industrial Sector SPDR ETF (XLI), Materials Sector SPDR ETF (XLB), Technology Sector SPDR ETF (XLK), Communication Services Sector SPDR ETF (XLC), Utilities Sector SPDR ETF (XLU), Real Estate Sector SPDR ETF (XLRE).
Figure 1, Analysts Keep Raising Earnings Estimates, Led by Energy and Technology: MarketDesk, based on consensus analyst estimates for market-cap-weighted indexes, as of October 31, 2026. Estimate revisions show the percentage change in analysts’ next-12-month earnings-per-share estimates. Relative trend is based on one- and six-month revisions.
Figure 2, Microsoft Revenue Has Outgrown Its Workforce: Microsoft annual reports (Form 10-K), fiscal years ending June 30, 2007 to 2026. Revenue for fiscal 2016 and 2017 reflects restated figures. Full-time employees as of fiscal year end. References to specific companies are for illustrative purposes only and do not constitute a recommendation to buy or sell any security.
Figure 3, Productivity Has Outpaced Typical Worker Pay Since 1979: Economic Policy Institute analysis of Bureau of Labor Statistics and Bureau of Economic Analysis data, 1948 to 2022. Productivity is net output per hour worked, total economy. Pay is inflation-adjusted hourly compensation of private-sector production and nonsupervisory workers. Index, 1979 = 100.
Figure 4, Where Federal Revenue Comes From: Congressional Budget Office, Monthly Budget Review. Shares of total federal receipts, fiscal years 2024 to 2026. Fiscal 2026 figures are CBO preliminary estimates as of October 8, 2026.
Figure 5, Energy Prices, Tariffs, and the AI Buildout Have Lifted Inflation: Bloomberg; J.P. Morgan Asset Management, as of November 2, 2026 (left); Oxford Economics, third quarter 2026 (right). As published in Michael Cembalest, “Eye on the Market,” J.P. Morgan Asset Management, November 2026. Values are approximate.
Figure 6, Housing Is Weak and Households Expect Their Finances to Worsen: Bloomberg; Haver Analytics, September 2026 (left); University of Michigan Surveys of Consumers; Bloomberg; J.P. Morgan Asset Management, October 2026 (right). As published in Michael Cembalest, “Eye on the Market,” J.P. Morgan Asset Management, November 2026. Values are approximate.
Figure 7, Deficits Are the Largest Driver of Higher Real Long-Term Rates: Empirical Research Partners, October 13, 2026 (left); Bloomberg; J.P. Morgan Asset Management, September 2026 (right). As published in Michael Cembalest, “Eye on the Market,” J.P. Morgan Asset Management, November 2026. Values are approximate.
Figure 8, Treasury Yields After Midterms That Produced Divided Government: Bloomberg. Change in the 10-year Treasury yield one month and 12 months after midterm elections that produced divided government, 1994 to 2022. Past performance is no guarantee of future results.
Table 1, Treasury Yields and the Yield Curve After Past Jobless Recoveries: Federal Reserve Bank of St. Louis (FRED); National Bureau of Economic Research.
This commentary reflects the author’s views as of November 2026, which are subject to change without notice. References to specific companies are for illustration only, and client portfolios may or may not hold the securities mentioned. This commentary does not express a view on any political party or candidate. References to third-party research, including work by J.P. Morgan Asset Management, are for informational purposes only. Index returns cited in the text are drawn from MarketDesk Research and other noted sources and may differ from the ETF-based returns shown in the Market Data Center. Registration with the SEC does not imply a certain level of skill or training. The views expressed are the author’s own and may differ from those of the sources cited.
Bond prices generally fall when interest rates rise, and longer-maturity bonds are more sensitive to rate changes. All investing involves risk, including the possible loss of principal. Commodity investments can be volatile. Lower-rated bonds carry greater credit risk. Projections cited from the Congressional Budget Office, RAND, PIMCO, Oxford Economics, Empirical Research Partners, and other third parties are based on assumptions and may not be realized. Historical patterns, including market behavior following past elections and recoveries, may not repeat. Diversification and asset allocation do not ensure a profit or protect against loss in a declining market.
Sources
1. MarketDesk Research, monthly market chart book, November 2026; Federal Reserve, FOMC statement, October 28, 2026; CME FedWatch. Market, index, earnings, and sentiment data as of October 31, 2026.
2. U.S. Bureau of Labor Statistics: The Employment Situation, September 2026; Job Openings and Labor Turnover Survey, August 2026; Productivity and Costs, second quarter 2026.
3. Microsoft Corporation, fiscal 2026 Form 10-K; Bloomberg, October 26, 2026.
4. Challenger, Gray & Christmas, job cuts report, September 2026.
5. U.S. Census Bureau, Income in the United States: 2025 (September 2026) and historical income tables.
6. Economic Policy Institute, “The Productivity–Pay Gap,” updated October 2022.
7. Peter Turchin, End Times: Elites, Counter-Elites, and the Path of Political Disintegration (Penguin Press, 2023).
8. Congressional Budget Office, Monthly Budget Review: Summary for Fiscal Year 2026, October 8, 2026.
9. Russell Price and Krishna Suresh, RAND working paper WR-A4443-1, November 2025.
10. Anton Korinek and Lee Lockwood, The Digitalist Papers, Volume 2.
11. Social Security Administration, 2026 Annual Report of the Board of Trustees.
12. PIMCO, Tiffany Wilding and Allison Boxer Scott, July 2026.
13. Congressional Budget Office, The Budget and Economic Outlook: 2026 to 2036, February 2026.
14. Federal Reserve Bank of New York, ACM term premium estimates; U.S. Department of the Treasury, Treasury International Capital data, August 2026.
15. Federal Reserve Bank of St. Louis (FRED); National Bureau of Economic Research.
16. Michael Cembalest, “Eye on the Market,” J.P. Morgan Asset Management, November 2026, including data from Bloomberg, Oxford Economics, Empirical Research Partners, Haver Analytics, and the University of Michigan.
17. The Associated Press, 2026 general election results, as of November 6, 2026. Seat counts are preliminary, and some races remain uncalled.
18. Bloomberg; Federal Reserve Bank of St. Louis (FRED).
The information herein was obtained from sources which LaSalle St. believes to be reliable, but we do not guarantee its accuracy. Neither the information, nor any opinions expressed, constitute a solicitation of the purchase or sale of any securities or related instruments.